Download
1 / 64
640 likes | 834 Vues
Developments in Seasonal Atlantic Basin Tropical Cyclone Prediction Phil Klotzbach Department of Atmospheric Science Colorado State University Ph. D. Defense July 9, 2007. Acknowledgments. Mentor – Dr. Gray Ph. D. Advisor – Dr. Schubert Ph. D. Committee Members – Drs. Mielke and Pielke

E N D
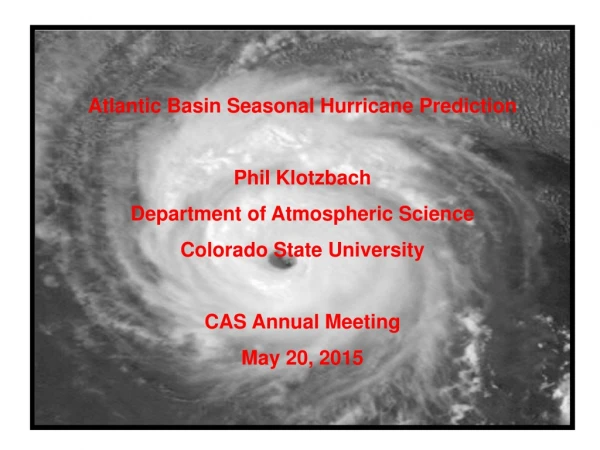
Developments in Seasonal Atlantic Basin Tropical Cyclone Prediction Phil Klotzbach Department of Atmospheric Science Colorado State University Ph. D. Defense July 9, 2007
Acknowledgments • Mentor – Dr. Gray • Ph. D. Advisor – Dr. Schubert • Ph. D. Committee Members – Drs. Mielke and Pielke • CSU Student Colleagues – Eric Blake, Matt Eastin, Brian McNoldy, Stacey Seseske, Wes Terwey, Jonathan Vigh • Friends and Family – Especially my parents for providing me with an outstanding home education • National Science Foundation and Lexington Insurance Company
Outline • Introduction • Data • Atlantic Basin Multi-Decadal Variability • Seasonal Forecast Developments • 2007 Hurricane Forecast • United States Landfalling Hurricane Probability Webpage • Hurricanes and Global Warming
Introduction The globe’s atmosphere and oceans function as one unit. Current circulation features have considerable precursor information regarding the coming month’s or coming season’s amount of hurricane activity.
OUTGOING LONGWAVE RADIATION LATENT HEAT FLUX SENSIBLE HEAT AND POTENTIAL ENERGY FLUX ABSORBED SOLAR RADIATION NET ENERGY BALANCE SUBSURFACE HEAT STORAGE THERMAL INERTIA OCEAN HEAT FLUX TEMPERATURE Flow diagram for climate modeling, showing feedback loops. From Robock (1985).
Arago’s Admonition: “Never, no matter what may be the progress of science, will honest scientific men who have regard for their reputations venture to predict the weather.”
Data • NCEP/NCAR Reanalysis – globally gridded (2.5° x 2.5°) dataset for many surface and upper-level features from 1948-present • National Hurricane Center “best track” dataset – best estimates of six-hourly location and intensity of tropical cyclones
Atlantic Basin Multi-decadal Variability
SURFACE 500 METERS
STRONG THC WARM
H H 3 1 2 Courtesy of John Marshall (MIT)
THC - Strong ? 1860 1900 1940 1980 2020 (Goldenberg et al. 2001)
AMO Index Major Hurricanes per Year 1.2 2.6 1.5 3.9
SSTA + SSTA - + – – SLPA – + SLPA + gyre - gyre + + – STRONG THC WEAK THC
Seasonal Forecast Developments
2007 Forecast Schedule
New Forecast Development Methodology • Use predictors using surface data from the two months prior to the forecast issue date • Hindcast Net Tropical Cyclone activity metric only • Develop forecast on data from 1950-1989 • Test forecast on “independent” data from 1990-2004 • New forecast schemes must show comparable skill in both time periods
New December Forecast Predictors Oct-Nov SST 2 1 Oct-Nov SLP 3` EQ. Oct-Nov SLP
New April Forecast Predictors Feb-Mar SST 1 EQ. 2 3` Feb-Mar SLP Feb-Mar SST
New June Forecast Predictors April-May SST 1 Predicted July-Nov AMM Index 3` 2 EQ. April-May SST
New August Seasonal Forecast Predictors Pre 1-August NSD S of 23.5°N, E of 75°W 1 4 2 June – July SST 3 EQ. June – July SLP June – July SST
August Statistical Scheme – Hindcast Skill for NTC (1900-1948) Observations Hindcasts
August Statistical Scheme – Hindcast Skill for NTC (1949-2005) Observations Hindcasts
Top 10 – Bottom 10 Atlantic Basin TC Ratios for 1900-1948 Period Using Forecast Equations Developed on 1949-1989
16 Landfalls 3 Landfalls
Top 10 versus Bottom 10 Florida Peninsula and East Coast Major Hurricane Landfalls based on NTC Hindcasts (1949-2005)
PROBABILITIES FOR AT LEAST ONE MAJOR (CATEGORY 3-4-5) HURRICANE LANDFALL ON EACH OF THE FOLLOWING COASTAL AREAS FOR 2007 • Entire U.S. coastline – 74% (average for last century is 52%) • 2) U.S. East Coast including Peninsula Florida - 50% (average for last century is 31%) • 3) Gulf Coast from the Florida Panhandle westward to Brownsville - 49% (average for last century is 30%) • 4) Expected above-average major hurricane landfall risk in the Caribbean
New Landfalling Hurricane Web Application Currently Available at the following URL: http://www.e-transit.org/hurricane In partnership with the GeoGraphics Laboratory – Bridgewater State College, Bridgewater MA
REGION 2 - TEXAS & LOUISIANA H A J L C O J C V C (b) (c) (a)