Recent Super-K Neutrino Oscillation Results from 2002 - Insights and Findings
Discover the latest results from the Super-Kamiokande neutrino oscillation experiment, including methods, data sets, analysis, and systematic errors. Learn about atmospheric oscillations, particle identification, and the solar neutrino problem.

Recent Super-K Neutrino Oscillation Results from 2002 - Insights and Findings
E N D
Presentation Transcript
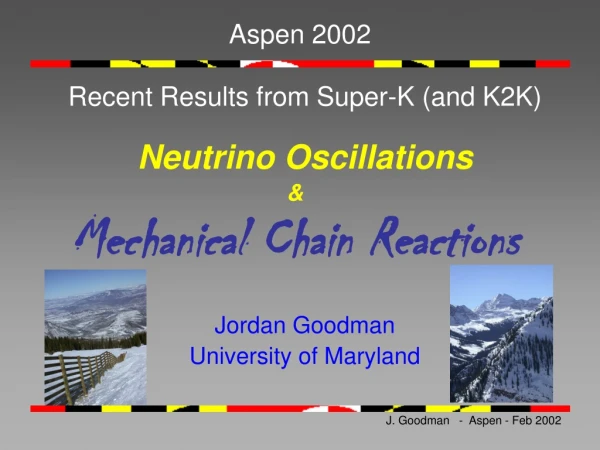
Aspen 2002 Recent Results from Super-K (and K2K) Neutrino Oscillations Jordan Goodman University of Maryland & Mechanical Chain Reactions
Detecting neutrinos Cherenkov ring on the wall Electron or muon track The pattern tells us the energy and type of particle We can easily tell muons from electrons
Neutrino Production Ratio predicted to ~ 5% Absolute Flux Predicted to ~20% :
about 15 km about 13,000 km Atmospheric Oscillations We look for n transformations by looking at ns with different distances from production SK Neutrinos produced in the atmosphere
n - e e + W n p Atmospheric Neutrino Interactions Reaction Thresholds Electron: ~1.5 MeV Muon: ~110 MeV Tau: ~3500 MeV Neutral Current Charged Current
Telling particles apart Muon Electron
Muon - Electron Identification PID Likelihood sub-GeV, Multi-GeV, 1-ring Monte Carlo (no oscillations) We expect about twiceas many nm as ne
Super-K Atmospheric Data Set • 1289.4 days of data (22.5 kilotons fiducial volume) • Data Set is divided into: • Single and Multi Ring events • Electron-like and Muon-like • Energy Intervals • 1.4 GeV< Evis >1.4 GeV • Also Evis< 400MeV (little or no pointing) • Fully or partially contained muons (PC) • Upward going muons - stopping or through going • Data is compared to Atmospheric Monte Carlo • Angle (path length through earth) • Visible energy of the Lepton
Low Energy Sample No Oscillations Oscillations (1.0, 2.4x10⁻³eV2)
Multi-GeV Sample No Oscillations Oscillations (1.0, 2.4x10⁻³eV2) Down UP Down UP going
Summary of Atmospheric Results Compelling evidence for nm to nt atmospheric neutrino oscillations Best Fit for nmto nt Sin22q =1.0, DM2=2.4 x 10⁻³eV2 c2min=132.4/137 d.o.f. No Oscillations c2min=316/135 d.o.f. 99% C.L. 90% C.L. 68% C.L. Best Fit Now the most cited exp. HEP paper
Tau’s require greater than 3 GeV in neutrino energy This eliminates most events Three correlated methods were used All look for enhanced upward going multi-ring events All show slight evidence for Tau appearance None are statistically significant Tau Appearance?
The p0 sample • For nmto ns the rate of NC events is reduced as compared to nmto nt • The SK NC enriched sample is only about 1/3 from NC interactions. • The p0 sample is the cleanest NC signal • Until now the error in s(p0)(~1-2 Gev) has been as large as the effect!
Original SK Systematic Errors • Systematic Error in rp0=(p0/Q.E.) • Cross section – 20% • Reconstruction – 7% • Nuclear Interaction – 7% • Flux – 3% • Total Systematic – 23%
K2K Near Detector K2K beam is: ~1.3 GeV 98.2% nm 1.3% ne 0.5% nm
Use K2K to measure the Cross Section • A normalized p0 rate is defined as rp0=(p0/mfc) • Form double ratio of Rp0= rp0(data)/rp0(MC) to minimize flux uncertainties and nuclear effects • Simulate both K2K and SK flux and efficiencies • K2K finds Rp0 = 1.04 ± 0.02 ± 0.02 ± 0.09 Stat (data MC) Sys • Old SK Rp0 = 1.05 ± 0.05 ± 0.01 ± 0.23 • Both are consistent with Rp0 = 1 • Use K2K measurement to improve SK result
New Systematic Errors in SK • Using K2K Result • Reconstruction – 7% • Flux – 3% • Spectral Diff between SK and K2K – 5% • Cross section/Nuclear effects – 12% (flux averaged) • Total Systematic – 14%
n e - e - W n - e e Charged Current n (electron ’s only) Solar Neutrinos in Super-K • The ratio of NC/CC cross section is ~1/6.5
Solar Neutrinos in Super-K • Super-K measures: • The flux of 8B solar neutrinos (electron type) • Energy, Angles, Day / Night rates, Seasonal variations • Super-K Results: • We see the image of the sun from 1.6 km underground • We observe a lower than predicted flux of solar neutrinos (45%) Skip Solar
Solar Neutrinos Toward Sun From Sun
95% excluded by SK flux-independent zenith angle energy spectrum 95% C.L allowed. - SK flux constrained w/ zenith angle energy spectrum Enlarged View Combined Results netonm,t SK + Gallium + Chlorine - flux only allowed 95% C.L.
Combined Results netonsterile SK + Gallium+ Chlorine - flux only allowed 95% C.L. 95% excluded by SK flux-independent zenith angle energy spectrum 95% C.L allowed. - SK flux constrained w/ zenith angle energy spectrum
SNO measures just ne SK measures mostly ne but also other flavors (~1/6 strength) From the difference we see oscillations! This is from nm & nt neutral current } SNO Results - Summer 2001
Combining SK and SNO • SNO measures just electron neutrinos and gets Fne= (35% ± 3%)Fssm • This implies that Fnm,t= ~65% Fssm (~2/3 have oscillated) • SK measures Fes =(Fne + (Fnm,t)/6.5) • Assuming osc. SNO predicts that SK will see Fes ~ (35%+ 65%/6.5) Fssm = 45% ± 3% Fssm • SK observes:
Super-K Disaster - Nov 12, 2001 • Chain reaction destroyed 7000 OD and 1000 ID Tubes • The cause is not completely understood, but it started with a lower pmt collapse. • There are plans to rebuild… • ½ density detector within 1 year • Eventually rebuild completely