Scatter Plots Module 1, Section 4
Scatter Plots Module 1, Section 4. Making a Scatter Plot. Scale are the numbers written along an axis. The numbers can increase by ones, twos, fives, tens, or some other number. A squiggle on an axis tells that some of the scale has been left out. . Making a Scatter Plot.

Scatter Plots Module 1, Section 4
E N D
Presentation Transcript
Making a Scatter Plot • Scale are the numbers written along an axis. The numbers can increase by ones, twos, fives, tens, or some other number. • A squiggle on an axis tells that some of the scale has been left out.
Making a Scatter Plot • Scatter plot is the graph of a set of data pairs. It can help you recognize patterns and make predictions.
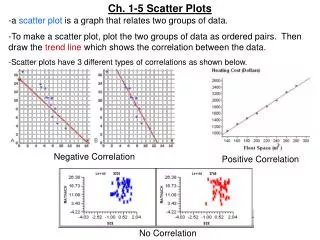
Fitting a Line • Two variables that are related in some way are said to be correlated. • Positive correlation happens if one variable tends to increase as the other increases.
Fitting a Line • Negative correlation happens if one variable tends to decrease as the other increases.
Fitting a Line • No correlation happens when there isn’t a consistent increase or decrease of a variable as the other increases.
Fitting a Line • When data points show a correlation, a fitted line can be drawn to show the pattern in the data.