Enhancing Business Decisions with Function Representations
120 likes | 212 Vues
Explore how to translate between different function representations to optimize decision-making in business applications. Learn to analyze and predict trends using graphs, tables, and equations. Practice finding best-fitting models.

Enhancing Business Decisions with Function Representations
E N D
Presentation Transcript
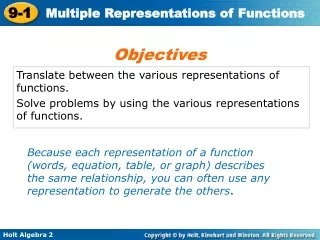
Multiple Representations of Functions Essential Questions • How do we translate between the various representations of functions? • How do we solve problems by using the various representations of functions? Holt McDougal Algebra 2 Holt Algebra 2
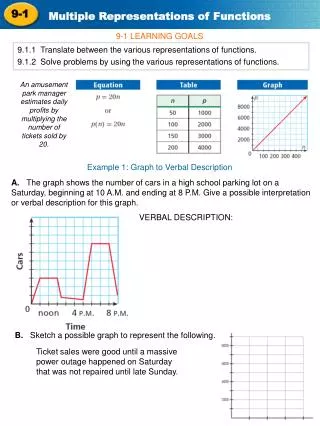
An amusement park manager estimates daily profits by multiplying the number of tickets sold by 20. This verbal description is useful, but other representations of the function may be more useful. These different representations can help the manager set, compare, and predict prices.
Business Application Sketch a possible graph to represent the following. Ticket sales were good until a massive power outage happened on Saturday that was not repaired until late Sunday. The graph will show decreased sales until Sunday.
Business Application Sketch a possible graph to represent the following. The weather was beautiful on Friday and Saturday, but it rained all day on Sunday and Monday. The graph will show decreased sales on Sunday and Monday.
Business Application Sketch a possible graph to represent the following. Only ½ of the rides were running on Friday and Sunday. The graph will show decreased sales on Friday and Sunday.
Approximate the best-fitting line Example 4 The table below gives the number of people y who attended each of the first seven football games x of the season. Approximate the best-fitting line for the data. 900 850 800 750 700 Use Stat – Calc – 4 – LinReg 650 0 1 2 3 4 5 6 7 Type equation into y =, and graph.
Approximate the best-fitting line Example 5 The table gives the average class score y on each chapter test for the first six chapters x of the textbook. 92 90 88 86 84 Use Stat – Calc – 4 – LinReg 82 0 1 2 3 4 5 6 7 Type equation into y =, and graph.
Approximate the best-fitting quadratic Example 6 The table shows the height of a baseball that is hit, with x representing the time and y representing the baseball’s height. 35 30 25 20 15 Use Stat – Calc – 5 – QuadReg 10 0 1 2 3 4 5 6 7 8 Type equation into y =, and graph.
Approximate the best-fitting quadratic Example 7 Use a graphing calculator to find the best-fitting model for the data in the table. 30 25 20 15 10 Use Stat – Calc – 5 – QuadReg 5 0 1 2 3 4 5 6 7 8 Type equation into y =, and graph.