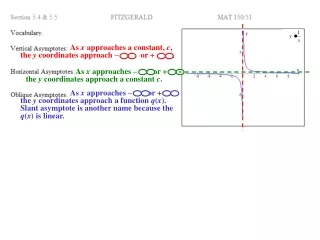
Download
1 / 5
70 likes | 241 Vues
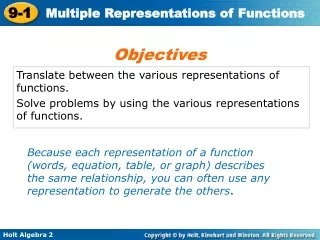
9-1 LEARNING GOALS. 9.1.1 Translate between the various representations of functions. 9.1.2 Solve problems by using the various representations of functions. An amusement park manager estimates daily profits by multiplying the number of tickets sold by 20.

E N D
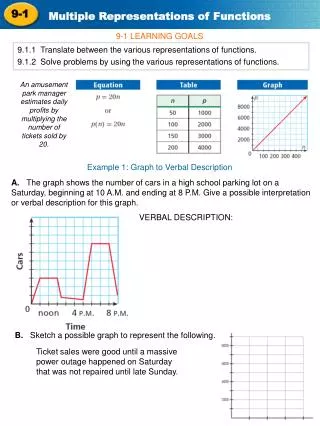
9-1 LEARNING GOALS 9.1.1 Translate between the various representations of functions. 9.1.2 Solve problems by using the various representations of functions. An amusement park manager estimates daily profits by multiplying the number of tickets sold by 20. Example 1: Graph to Verbal Description A. The graph shows the number of cars in a high school parking lot on a Saturday, beginning at 10 A.M. and ending at 8 P.M. Give a possible interpretation or verbal description for this graph. VERBAL DESCRIPTION: B. Sketch a possible graph to represent the following. Ticket sales were good until a massive power outage happened on Saturday that was not repaired until late Sunday.
Example 2: Verbal Description to Table, Equation and Graph A. Janet is rowing across an 80-meter-wide river at a rate of 3 meters per second. Create a (1) table, an (2) equation, and a (3) graph of the distance that Janet has remaining before she reaches the other side. (4) When will Janet reach the shore? Step 1 Create a table. What t-values make sense? What d-values make sense? Is the distance increasing or decreasing? By how much? Step 2 Write an equation. __________________ Step 3 Graph the equation. What family of functions will it belong to? What ways could we graph it? __________________________ __________________________ __________________________ Step 4 Answer the question. What would the answer look like in the table? How could you use the equation to get the answer? What would the answer look like on the graph? Janet will reach the shore after ______ seconds.
B. The table shows the height, in feet, of an arrow in relation to its horizontal distance from the archer. Create a (2)graph, an (1)equation, and a (3)verbal description to represent the height of the arrow with relation to its horizontal distance from the archer. Step 0 Use the table to check constant differences. First differences: Second differences Step 1 Write the equation. With Graphing Calculator: To get the equation: STAT Edit Fill in L1 & L2 2nd MODE STAT (right) Calculate QuadReg Enter Enter Step 1 contd. Write an equation. EQUATION:_____________________ Step 2 Graph the equation in calculator or plot points from the table by hand. With Graphing Calculator: To graph the equation and points: Y= Type Equation in Y1 2nd Y= 1: Plot1 … Enter On Enter Zoom 9: Zoom Stat GRAPH Step 3 Interpret graph into a verbal description of what happened. With Graphing Calculator: To find y-intercept: 2nd Trace 1:Value Enter 0 Enter To find x-intercepts/zeros: 2nd Trace 2:Zero Enter (scroll left of x-intc) Enter (scroll right of x-intc) Enter Enter To find max/min:2nd Trace 3:min or 4: max Enter (scroll left of max/min) Enter (scroll right of max/min) Enter Enter INTERPRETATION: The arrow was shot from an initial height of __________ft. The arrow traveled a total horizontal distance of __________ft reaching a height of __________ft after traveling __________ft in the horizontal direction.
C. An online computer game company has 10,000 subscribers paying $8 per month. Their research shows that for every 25-cent reduction in their fee, they will attract another 500 users. Use a table and an equation to find the fee that the company should charge to maximize their revenue. Linear? Quadratic? EQUATION: _____________________ SKETCH OF GRAPH: MAXIMUM PROFIT: ______________ from FEE: ________________
Example 3: Table to Equation Bartolo opened a new sporting goods business and has recorded his business sales each week. To break even, Bartolo needs to sell $48,000 worth of merchandise in a week. Assuming the sales trend continues, use a graph and an equation to find the number of weeks before Bartolo breaks even. Is the data Linear, Quadratic, or Exponential? EQUATION: _____________________ SKETCH OF GRAPH: After _____________ weeks Bartolo will have made at least $48,000 to break even