Download
1 / 13
140 likes | 412 Vues
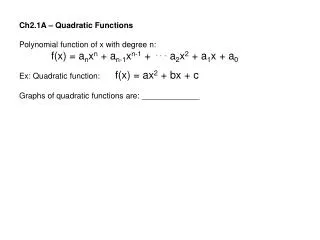
2.2 – Translate Graphs of polynomial functions. Coach Bianco. Unit 2.2 – Evaluate and Graph Polynomial Functions. Georgia Performance Standards: MM3A1a – Graph simple polynomial functions as translations of the function f(x) = ax n .

E N D
2.2 – Translate Graphs of polynomial functions Coach Bianco
Unit 2.2 – Evaluate and Graph Polynomial Functions • Georgia Performance Standards: • MM3A1a – Graph simple polynomial functions as translations of the function f(x) = axn. • MM3A1c – Determine whether a polynomial function has symmetry and whether it is even, odd, or neither • MM3A1d – Investigate and explain characteristics of polynomial functions, including domain and range, intercepts, zeros, relative and absolute extrema, intervals of increase and decrease, and end behavior.
Unit 2.2 – Evaluate and Graph Polynomial Functions • Translate a polynomial function vertically • Translate a polynomial function horizontally • Translate a polynomial function
What does it mean to translate? • Metaphrase • Paraphrase • Rendering • Rendition • Rephrasing • Restatement • Adaptation • Construction • Decoding • Elucidation • Explanation • Key
What are we actually doing? • Comparing two things to each other (In our case, functions) • This is something you’ve actually done before!
Comparing Functions… What are we looking for? Check list: Vertical shift up or down? Horizontal shift left or right? Domain & Range Symmetric? x & y intercepts End behavior • You have to always graph both functions to compare them! • Write down everything you can think of! • How do we compare two functions? • Make a table (I suggest -2,-1,0,1,2 for your input) • Connect the dots!! (Make them into a curve) • Check out your end behavior (Degree & L.C. what do they mean?)
Yes, we’re using this again… • End Behavior Rules! • The end behavior of a polynomial function’s graph is the behavior of the graph as x approaches positive ∞ or negative ∞ • Degree is odd & leading coefficient positive f(x) ∞ as x ∞ and f(x) -∞ as x -∞ • Degree is odd & leading coefficient negative f(x) -∞ as x ∞ and f(x) ∞ as x -∞ • Degree is even & leading coefficient positive f(x) ∞ as x ∞ and f(x) ∞ as x - ∞ • Degree is even & leading coefficient negative f(x) -∞ as x ∞ and f(x) - ∞ as x -∞
Example 1 • Graph g(x) = x4 + 5. Compare the graph with the graph of f(x) = x4. What do we know?
Example 2 • Graph g(x) = x4 - 2. Compare the graph with the graph of f(x) = x4. What do we know?
What do we notice? • Is there anything happening to the functions that are • making them shift left or right? • What about up or down?
Example 3 • Graph g(x) = 2(x - 2)3 . Compare the graph with the graph of f(x) = 2x3. What do we know?
Example 4 • Graph g(x) = -(x + 1)4 -3. Compare the graph with the graph of f(x) = x4. What do we know?