Download
1 / 24
240 likes | 545 Vues
King County Buildable Lands. A Review of Recent Growth and Future Capacity. King County Buildable Lands: 1993 - 2000. Introduction and Methodology Key Outcomes Residential Development Activity: Households and Population Accommodated Densities Achieved Residential Land Supply

E N D
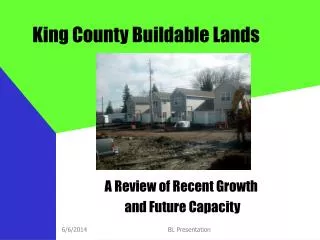
King County Buildable Lands A Review of Recent Growth and Future Capacity BL Presentation
King County Buildable Lands: 1993 - 2000 • Introduction and Methodology • Key Outcomes • Residential Development Activity: • Households and Population Accommodated • Densities Achieved • Residential Land Supply • Residential Capacity • Commercial and Industrial Development Activity: • Job Growth • F.A.R.’s Achieved • Commercial / Industrial Land Supply • Commercial Capacity • Conclusions BL Presentation
Buildable Lands: Introduction • In 1997, the Washington State legislature adopted the Buildable Lands amendment to the Growth Management Act. • The purpose of Buildable Lands is to measure capacity to absorb growth, and to evaluate the effectiveness of local plans and regulations. • The amendment requires six Washington counties and their cities to determine the amount of land suitable for urban development, and evaluate its capacity for growth, based upon measurement of five years of actual development activity. • King County and the other five counties must report to the State by September 1, 2002 and every five years thereafter. • Major elements of the Buildable Lands program include: • annual data collection to determine the amount and density of new development; • updated inventories of the supply of land suitable for development; • assessment of the ability of each jurisdiction and the entire Urban Growth Area to accommodate expected growth; • preparation of a Five-Year Evaluation Report; • and (later) analysis of remedial measures where necessary. BL Presentation
Key Questions • How does the actual growth in recent years compare to targeted growth levels? • Is the capacity of the land supply adequate to accommodate current growth targets? • Has development occurred at densities consistent with planning assumptions and targets? • Are urban densities being achieved within the Urban Growth Area? BL Presentation
Buildable Lands Key Conclusions • King County has achieved: • 38% of its housing target in 40% of the 20 year planning period. • Over 50% of the population forecast for that period. • King County has capacity for 263,000 more housing units - more than twice the capacity needed to accommodate the remaining household growth target. • King County has the capacity for over 600,000 more jobs - several times the remaining target of 110,000 jobs. • Densities being achieved in all urban subareas are sufficient to accommodate targeted growth. BL Presentation
Some Caveats Buildable Lands is Not: • A market feasibility study • An inventory of land available for development • An infrastructure capacity analysis • A housing affordability study • A prediction of economic climate BL Presentation
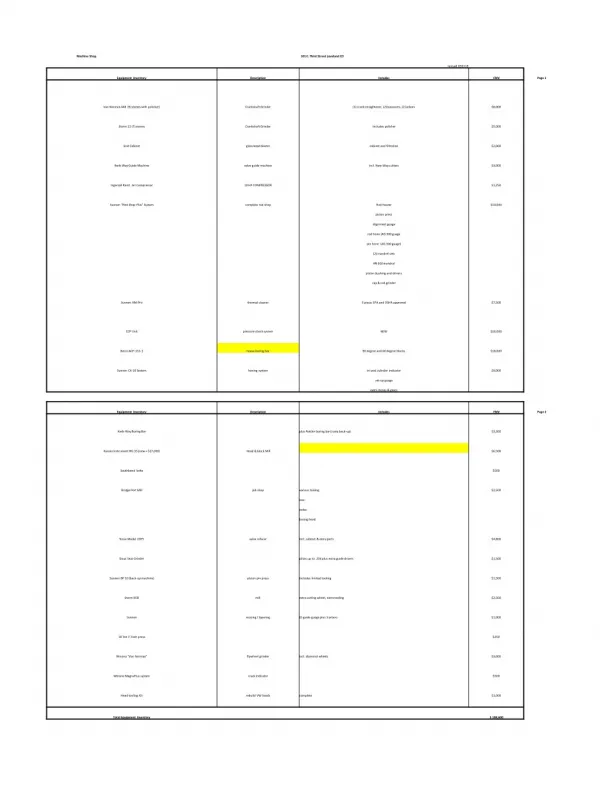
Land Supply Inventory 2001 Vacant and redevelopable parcels Critical areas ROWs and public facilities Market factor Net acres/sq. ft. of land Annual Development Activity 1996-2000 Net densities achieved— DUs per acre Floor Area Ratio Growth Targets Remaining 2001-2012 CPP Growth Targets for households and employees (1992-2012) Net residential and employment growth (1993-2000) Development Capacity Analysis 2001 Housing units Employees Evaluation Are development capacities adequate to accommodate remaining 2012 growth targets for households and employees? Buildable LandsProgram:Elements of Methodology BL Presentation
Residential Development Activity • King County gained nearly 75,000 housing units during the first eight years of the Growth Management Period. • This represents 38% of the Countywide target. BL Presentation
Housing and Population Growth: 1993 - 2000 • In these eight years (40% of the 20 year planning period), the new housing units accommodated about 160,000 persons. • This represents more than 50% of the new population forecast for 1993 - 2012. BL Presentation
Development Activity by SubAreaPermit Densities Achieved: 1996 - 2000 • Single family densities averaged 3.8 du/acre in the UGA. • Multifamily densities averaged 22.0 du/acre throughout the UGA. • SeaShore had an average density of 52.2 du/acre in its multifamily zones, and 6.6 du / acre in its single-family zones. • In all zones, King County achieved a density of about 7.3 du/acre. BL Presentation
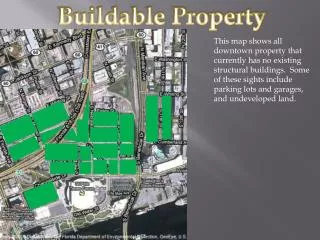
Residential Land Supply: Snapshot as of January 1, 2001 • The urban area of King County contains almost 27,000 acres of vacant or redevelopable residential land. • Almost 43% of this land is in South King County (11,500 acres). • Reductions for critical areas, rights of way, public purposes, and a market factor cut the net land supply to about half of the gross land supply in the County. BL Presentation
Land Supply by Type • Vacant land accounts for 43% of the land supply in King County. • 57% of the land supply is redevelopable land. • 84% of the residential land supply is in single family zones BL Presentation
Residential Capacity • The land supply has the capacity to accommodate almost 263,000 new residential units up to 2012. • The capacity includes room for 80,000 single family homes and 165,000 units in multifamily and mixed use zones. • Almost half of this housing capacity is in the SeaShore subarea. • A significant share of the County’s residential capacity is in mixed use zones - about 103,000 units. BL Presentation
Residential Capacity in Relation to Household Targets as of January 1, 2001 • King County built nearly 75,000 units during the first eight years of the 20 year planning period, and achieved about 38% of its household target • It has a remaining target of about 121,000 units to be built by 2012. It has capacity for about 263,000 more units. • There is a surplus of 143,000 units of capacity beyond what is needed to meet the 2012 target. Each subarea also has a surplus of capacity beyond the 2012 target. BL Presentation
Employment Growth / Employment Capacity • King County gained 230,000 jobs during the 1993 - 2000 period, more than two-thirds of the 20-year growth target. • The highest employment growth was in the East County, which gained 107% of its target - or a total of 96,000 jobs. BL Presentation
Employment Capacity in Relation to Job Targets • King County has the capacity for over 600,000 more jobs within the Urban Growth Area (UGA). • Commercial and Mixed-Use zones have capacity for about 478,000 new jobs, while industrial zones can accommodate another 102,600 jobs. • An additional 22,400 jobs are projected for urban planned developments, for which land has already been set aside. BL Presentation
Conclusions • King County has been successful in accommodating strong population and employment growth from 1993 - 2000. • King County has well over the capacity needed to accommodate the growth that is expected to occur by 2012. • Ample capacity exists to accommodate further growth beyond the 2012 planning horizon. • All the subareas of King County show adequate capacity for the target period and beyond. • Capacity issues at the city level are being addressed by the targets review now underway. • Densities of recent residential and commercial / industrial projects indicate efficient use of the land supply. BL Presentation
Development Activity by SubAreaPLAT Densities Achieved: 1996 - 2000 • Densities in new plats, a better indicator of recent single-family land use trends, averaged 4.6 du per acre. • The highest amount of plat activity was in the South County, which created 5,650 lots, at an average density of 5.4 du / acre. BL Presentation
Development Activity by SubArea • The largest number of new housing units - 25,700- were permitted in the East County Sub-Area. • During the 1996 - 2000 period, nearly 2/3 of East County permits were issued for multifamily and mixed-use zones • The South County permitted nearly 23,000 units. More than half of the 1996 - 2000 permits were in single-family zones. • The SeaShore Sub-Area grew by 16,400 units. More than 3/4 were in multifamily and mixed use zones. • Development in the Rural Cities and their UGA’s was about equally divided between single and multifamily zones. BL Presentation
Commercial / Industrial Development Activity: 1996 - 2000 • The average floor area ratio (F.A.R.) achieved in all of urban King County was .47 for commercial and mixed use zones, and .46 for industrial zones. • Average F.A.R.’s for commercial zones differ considerably by sub-area. As would be expected, SeaShore has the highest average F.A.R. at 1.02 for commercial development. • There is more uniformity in industrial F.A.R.’s throughout the County, with a range of just .35 - .51. BL Presentation
Commercial and Industrial Land SupplySnapshot: January 1, 2001 • There is a total of 7,846 acres of urban land available for commercial and industrial development. • Roughly half of this land is vacant, and half is redevelopable. • In the South Subarea about 58% of the available land is vacant, while 42% is redevelopable. • On the Eastside, about 25% of the available land is vacant, and 75% is redevelopable land. BL Presentation
King County Buildable Lands: 1993 - 2000 • Introduction • Key Outcomes • Methodology • Residential Development Activity: • Households and Population Accommodated • Densities Achieved • Residential Land Supply • Residential Capacity • Employment Growth • Commercial / Industrial Land Capacity • Conclusions BL Presentation
Some Caveats: Questions this Report Won’t Answer • Not all land that has potential for development will be developed. • Some questions are outside the scope of this report, e.g.: • Is their adequate infrastructure in place? • Will the regional economy remain strong? • Will the demand for particular parcels in the current land supply be high enough to warrant its price and the cost of its development? • How do factors such as location, current zoning, and existing use affect this demand? • What areas of the county are most likely to develop? • Are sufficient amenities in place to make development feasible in areas with a more abundant land supply? • What can local jurisdictions do to make development more feasible and attractive? BL Presentation