Download
1 / 34
340 likes | 433 Vues
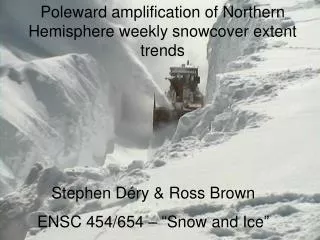
Poleward amplification of Northern Hemisphere weekly snowcover extent trends. Stephen D éry & Ross Brown ENSC 454/654 – “Snow and Ice”. Outline. Background Motivation & Goals Data, Methods & Data Issues Results Discussion Conclusions. Background.

E N D
Poleward amplification of Northern Hemisphere weekly snowcover extent trends Stephen Déry & Ross Brown ENSC 454/654 – “Snow and Ice”
Outline • Background • Motivation & Goals • Data, Methods & Data Issues • Results • Discussion • Conclusions
Background • Northern Hemisphere snowcover extent (SCE) varies between 4-46 x 106 km2. • Its distinct properties makes snow a key component of global climate. • Snow responds to changes in surface air temperatures & precipitation, thus providing another indicator of climate change.
Background • Previous studies reveal a 5% per decade decline in Northern Hemisphere SCE (Frei & Robinson 1999). • Declining mountain snowpacks & earlier spring freshets have been observed in recent decades over western North America (Mote et al. 2005; Stewart et al. 2005). • Changes in snow depth & snowcover duration have also been recorded (Brown and Braaten 1998; Stone et al. 2000).
Motivation & Goals • In light of near-record warmth in 2006 & the recent changes observed in the cryosphere, there is an urgent need to better understand SCE trends. • Objective: To develop & interpret weekly trends in Northern Hemisphere (NH), North American (NA) & Eurasian (EU) SCE for the period 1972-2006.
Data & Methods • Weekly values of SCE from January 1972 to December 2006 from Rutgers University. • Monotonic trends in weekly SCE assessed with Mann-Kendall test (MKT) over NH, NA (excluding Greenland) & EU. • MKT assumes a linear trend in the form: S = mt + b (1) • Where S is SCE, t is time (year) & m is the slope of the linear trend given by:
mk = (Sj – Si)/(tj – ti), k = 1, 2, …, n(n-1)/2 i = 1, …, n-1 j = 2, 3, …, n • All of the slopes mk are then ranked, with the median value representing the slope m of the linear trend. • The coefficient b is found by substituting the median values of SCE & time in Eq. (1) & solving for b.
Trends expressed in absolute values (× 106 km2), as a % from initial (1972) values, in standardized units, & insolation-weighted anomalies. Time series of weekly SCE data (Si) are standardized by: SSi = (Si – Si)/σi , (i =1-53) • Insolation-weighted anomalies are computed by multiplying the absolute values of SCE by the ratio of the average & maximum weekly incoming solar radiation at 60oN.
Data Issues • Continental snowcovers exhibit temporal persistence. • This implies positive autocorrelation of SCE values, meaning that time series of subsequent weekly SCE values do not form independent datasets. • Thus methodologies must be developed to reduce/remove the effect of serial correlation on trend analyses. • Trends & correlations are considered statistically-significant when p < 0.05.
Number of weeks with significant autocorrelations of continental SCE
Coherent variability & signal • Correlation between standardized NA & EU weekly SCE is r = 0.41 (p < 0.001). • Standardized weekly SCE are of the same sign 64% of the time (88% when greater than ±1 standard deviation). • Correlation between NA & EU trends in standardized SCE is r = 0.83 (p < 0.001). • This implies a hemispheric-scale process may be acting on continental snowcovers.
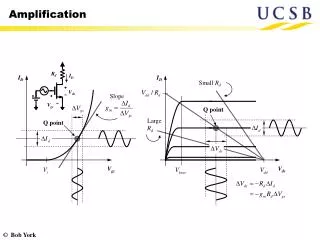
Poleward amplification of trends • Linear regressions on standardized SCE trends (January to early August) yield correlation coefficients of -0.89 to -0.96. • This suggests a poleward amplification of SCE anomalies owing to persistence in the cryospheric system. • Negative trends in early spring SCE amplify during late spring & summer, with implications to the growing season, vegetation growth, species composition, …
Snow-albedo feedback • Trends in insolation-weighted SCE values show greatest changes near the summer solstice. • This feature, in addition to the spatial coherence of the intercontinental snowcovers & temporal persistence on weekly & annual time scales, are possible manifestations of snow-albedo feedback.
Conclusions • Strong negative trends in NH, NA, & EU weekly SCE (1972-2006) are observed. • These trends are influenced by temporal persistence (i.e. serial correlation) in the cryospheric system. • Similar behaviour in NA & EU snowcovers, including covariability, persistence, & amplified trends in spring/summer provides evidence of the snow-albedo feedback acting on a hemispheric-scale.