Positioning
Positioning. STP – Segmentation, Targeting, Positioning. All consumers in the market. Product. Target market segment(s). Price. Target marketing and positioning. Marketing mix. Communication. Distribution. Marketing strategies of competitors. Outline.


Positioning
E N D
Presentation Transcript
STP – Segmentation, Targeting, Positioning All consumers in the market Product Target market segment(s) Price Target marketing and positioning Marketing mix Communication Distribution Marketing strategies of competitors
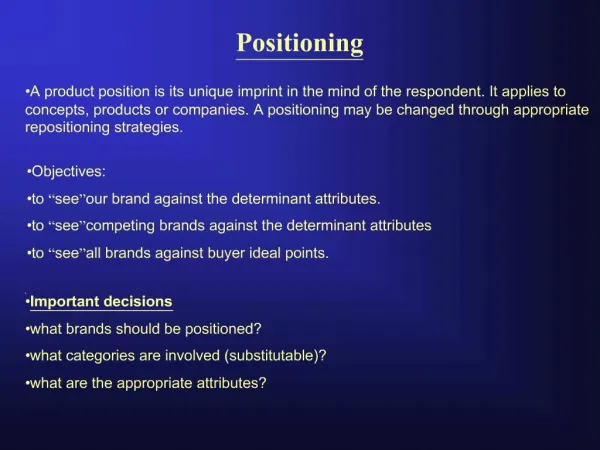
Outline • The concept of product positioning • Conducting a positioning study • Perceptual mapping using principal components analysis • Incorporating preferences into perceptual maps
Central questions in positioning(Rossiter and Percy) • A brand’s positioning should tell customers • what the brand is – what category need it satisfies (brand-market positioning), • who the brand is for – what the intended target audience is (brand-user positioning), and • what the brand offers – what benefits it provides (brand-benefit positioning) • The selection of benefits to emphasize should be based on • importance (relevance of the benefit to target customers’ purchase motives in the category), • delivery (the brand’s ability to provide the benefit), and • uniqueness (differential delivery of the benefit)
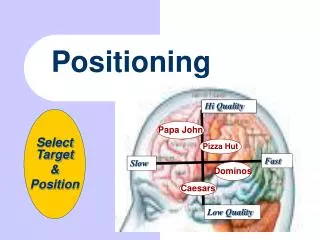
What is positioning? Category Need Who the brand is for? User What the brand is? Brand I D U Benefit(s) What the brand offers?
Positioning statement • To [the target audience] • ________ is the (central or differentiated) brand of [category need] • that offers [brand benefit(s)]. The positioning for this brand • should emphasize [benefit(s) uniquely delivered], • must mention [benefit(s) that are important “entry tickets”], • and will omit or trade off [inferior-delivery benefits].
Illustrative positioning statement for Volvo automobiles • To upper-income car buyers • Volvo is a (differentiated) brand of prestige automobile • that offers safety, performance, and prestige. The positioning for this brand • should emphasize safety and performance, • must mention prestige as an entry ticket to the category, • and will downplay the previous family-car association.
You know when your migraine pain starts, you’ve got to act fast. Introducing Advil Migraine. It’s the first and only FDA-approved Migraine medicine on the market that comes in liquid filled capsules. It gets into your system fast. Take control of your migraine before it takes control of you.
Issues to consider when thinking about positioning What are the central dimensions that underlie customers’ perceptions of brands in the product class? How do customers view our brand on these dimensions? How do customers view our competitors? Are we satisfied with the way our customers view our brand relative to the competition, or are changes required? Are there opportunities for new product introductions? How do perceptions relate to preferences? How can we improve our competitive position (market share) given the distribution of preferences in the market?
Implications Assumes that maltiness and bitterness are the two relevant attributes in this market Tells us how customers perceive the various brands on the two dimensions Brands that are close on the map compete for the same customers If we want to differentiate a brand, the map tells us which attributes to focus on The map suggests where there is white space and what we have to do to fill the white space (assuming there is demand for this type of product)
Positioning in practice • Perpendicular axes assume that the two attributes are uncorrelated • Attributes could be positively correlated • Attributes could be negatively correlated • If there are more than two attributes, we cannot (easily) plot the raw data Solution: use a data reduction method (e.g., principal components/factor analysis) • Perceptions are useful, but we also have to incorporate customers’ preferences Solution: joint perceptual/preference mapping
Conducting a positioning study • Design the study • What are the relevant brands? • What are the relevant perceptual dimension and preference measures? • What are the relevant (potential) customers? • Collect the data • Analyze the data • Perceptual mapping (principal component/factor analysis) • Joint perceptual/preference mapping
How to construct a perceptual map:Principal component analysis (PCA) • PCA as a data reduction technique: what are the central dimensions underlying customers’ perceptions of brands on more specific attributes? • Questions in PCA: • How many dimensions should be retained? • How should the dimensions be interpreted? • How can both brands and attributes be represented in the reduced perceptual space?
How to construct a perceptual map:PCA (cont’d) Assume we have n brands that are rated on p attributes by a sample of representative respondents. The original data are usually averaged across respondents, so the input data consist of average perceptions of the brands on the attributes of interest. It is difficult to map the brands in p dimensions, but if the attributes are correlated, we might be able to summarize the essential information contained in the original data in a space of reduced dimensionality.
Aggregation across respondents
How to construct a perceptual map:PCA (cont’d) • The basic idea is to redefine the dimensions of the space such that the first dimension (component, factor) captures as much variation in the ratings as possible, the second dimension is perpendicular to the first dimension and captures as much of the remaining variation in the ratings as possible, etc. • If a few of the new dimensions capture a large amount of the total variation in the data, the analysis can be simplified by retaining only 2 or 3 dimensions. • Look at the amount of variance explained by each factor – hopefully, a few factors will capture a substantial portion of the total variance. • If we can summarize the data with a few dimensions, we can graph the data in a low-dimensional space even if there are many different attributes.
Principal component analysis (cont’d) • How to interpret the retained factors? • Look at the correlations of the original attributes with the new dimensions (components, factors). They are called loadings and are summarized in a factor pattern matrix. Variables that load highly on a factor suggest what the factor means and how to name it. • The solution based on the reduced number of factors can also be rotated to increase the interpretability of the solution (i.e., we try to find an orientation in which each variable loads highly on a single factor).
Principal component analysis (cont’d) • How to construct a perceptual map? • Plot the correlations of the original attributes with the retained factors (the factor loadings) using vectors emanating from the origin; the (relative) length of the vectors indicates the amount of variance in a variable explained by the factors; • Plot the brands in the same factor space; • The projection of a brand on the attribute vectors or the factors (dimensions) indicates how the brand rates on the attributes or factors relative to other brands;
Office Star data Four different stores are rated on five attributes; The stores are Office Star (the target store), Paper & Co., Office Equipment, and Supermarket; The attributes are large choice, low prices, service quality, product quality, and convenience; 10 customers rated all stores on all attributes on a scale from 1 to 6 (e.g., the extent to which Office Star offers large choice); We also know customers’ overall preferences for the four stores (rated on a 1-5 scale);
Assignment for next week • Tuesday • ISBM Segmentation case • Thursday • LRB Chapter 4 • Positioning Tutorial (ME) • Office Star examples
Recap: Perceptual mapping • We have average perceptions for a number of brands on (many) different attributes/benefits; • We want to map both the attributes and the brands in a space of low dimensionality without losing too much of the original information;
Incorporating preferences into perceptual maps • Perceptual maps tell us how customers perceive brands, but they are silent about which brands they prefer; • In order to understand customers’ choices, we have to incorporate their preferences; • Two types of preference models can be distinguished: • Vector preferences: an increase in the amount of the attribute increases preference; • Ideal point preferences: there is an ideal amount of the attribute at which preference is highest;
Vector vs. ideal point preferences Ideal point preferences preference preference Amount of attribute Amount of attribute Vector preferences
Incorporating preferences (cont’d) • For vector preferences: • the brand whose (orthogonal) projection on a consumer’s preference vector is farthest from the origin (in the direction of the arrow) is the consumer’s preferred brand; • For ideal point preferences: • the brand that is closest to a consumer’s ideal point is the consumer’s preferred brand;
A simple way to incorporate preferences • For vector preferences: • calculate the average preference of target customers for each brand; add these averaged preferences as another “attribute” to the analysis; alternatively, we could use the market shares of the brands as a proxy indicator of preference; • the preference vector in the resulting map shows the direction of increasing preferences in the market; • For ideal-point preferences: • introduce a hypothetical ideal brand and have respondents rate this ideal brand on all the attributes; • the location of the ideal brand in the map indicates the most preferred combination of attributes;
Note: This assumes average preferences for HopDevil, Troegenator, Yuengling, Apricot Wheat, Penn Pilsner, and Stratus of 5.33, 4.83, 4.00, 4.17, 5.00, and 5.33.