Real vs. Nominal GDP
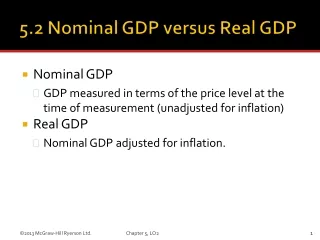
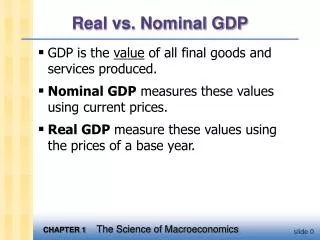
Real vs. Nominal GDP. GDP is the value of all final goods and services produced. Nominal GDP measures these values using current prices. Real GDP measure these values using the prices of a base year. Real GDP controls for inflation. Changes in nominal GDP can be due to:

Real vs. Nominal GDP
E N D
Presentation Transcript
Real vs. Nominal GDP • GDP is the value of all final goods and services produced. • Nominal GDP measures these values using current prices. • Real GDP measure these values using the prices of a base year.
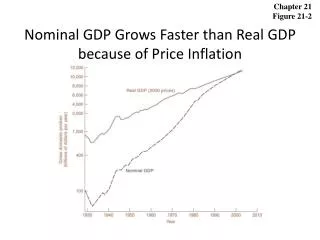
Real GDP controls for inflation Changes in nominal GDP can be due to: • changes in prices • changes in quantities of output produced Changes in real GDP can only be due to changes in quantities, because real GDP is constructed using constant base-year prices.
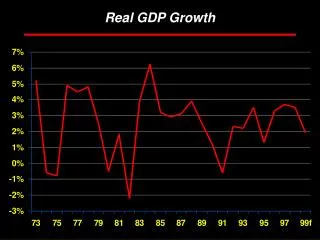
long-run upward trend… U.S. Gross Domestic Productin billions of chained 1996 dollars
How the BLS constructs the CPI • Survey consumers to determine composition of the typical consumer’s “basket” of goods. • Every month, collect data on prices of all items in the basket; compute cost of basket • CPI in any month equals
Exercise: Compute the CPI The basket contains 20 pizzas and 10 compact discs. prices: pizza CDs 2000 $10 $15 2001 $11 $15 2002 $12 $16 2003 $13 $15 For each year, compute • the cost of the basket • the CPI (use 2000 as the base year) • the inflation rate from the preceding year
answers: cost of inflation basket CPI rate 2000 $350 100.0 n.a. 2001 370 105.7 5.7% 2002 400 114.3 8.1% 2003 410 117.1 2.5%
GDP Deflator • The inflation rate is the percentage increase in the overall level of prices. • One measure of the price level is the GDP Deflator, defined as
CPI GDP deflator Two measures of inflation Percentage change 16 14 12 10 8 6 4 2 0 2 - 1948 1953 1958 1963 1968 1973 1978 1983 1988 1993 1998 Year
Okun’s Law • Employed workers help produce GDP, while unemployed workers do not. So one would expect a negative relationship between unemployment and real GDP. • This relationship is clear in the data…
8 6 4 2 0 -2 -3 0 1 2 3 4 -1 -2 Okun’s Law Okun’s Law states that a one-percent decrease in unemployment is associated with two percentage points of additional growth in real GDP Percentage change in real GDP 10 1951 1984 2000 1999 1993 1975 1982 Change in unemployment rate