Effective Risk Benchmarking
Gain insights on benchmarking against industries, third parties, and yourself. Utilize threat intelligence data for actionable insights and to resolve security issues.

Effective Risk Benchmarking
E N D
Presentation Transcript
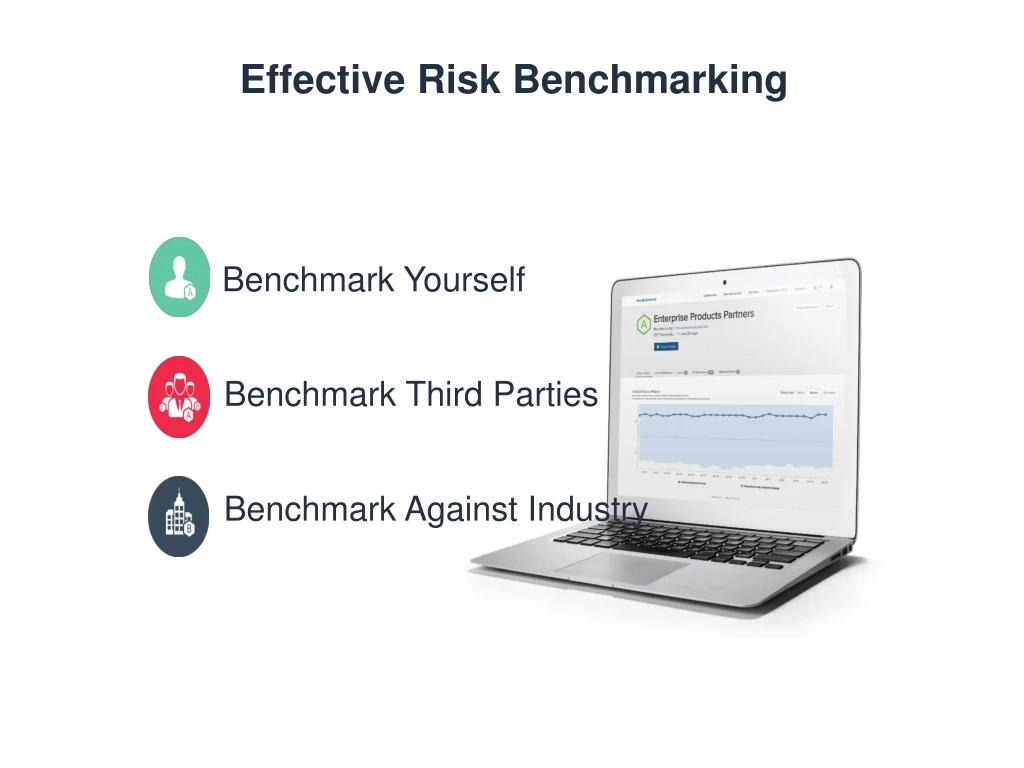
EffectiveRisk Benchmarking Benchmark Yourself Benchmark Third Parties Benchmark Against Industry
Gather as much threat intelligence data as possible using non- intrusive methods. 1 3 2 The threat data is normalized and scored Usingmachine learning algorithms. Based on the threat data, businesses get graded in a platform and are benchmarked to one another. Effective Security Benchmarking
Resolve issues Severity Alerts Recommended steps of action Actionable Intelligence
Identify Vendors At Risk CREATE A COLLABORATIVE WORKFLOW Vendor Scorecard Automatically Updated Invite Vendors ToView Scorecard Discuss At Risk Areas With Vendor Vendor Works With Security Scorecard To Remediate
AGENDA ANAYLSIS OF FINANCIAL SERVICES INDUSTRY
Goldman Sachs Morgan Stanley JPMorgan Chase Merrill Lynch Deutsche Bank Citi Barclays UBS HSBC Nomura 10 Most Profitable Companies in Financial Industry How about their cybersecurity score? Are they also performing well on security? However, only 10% of them received a grade of A.
10 Most Profitable Companies in Financial Industry More findings... 8 out of 10 companies: received a grade of F in Network Security 5 out of 10 companies: received an F in Patching Cadence All of these companies had malware issues, and received B or less in IP Reputation
Weaknesses Across Bottom Performers in Finance Network Security 80% F, 10% D, 10% C Social Engineering 60% F, 20% C IP Reputation (Malware) 50% F, 20% D
Network Security Score 45% D or worse How about other companies in Financial industry? IP Reputation Score 52% C or worse Patching Cadence Score 27% C or worse
Critical Data Point : Malware Infection spikes are a strong leading breach indicator Companies with a D or F in IP reputation are 3x more likely to get breached • To calculate the 3X, we used the IP Rep scores for all companies as of early March, and combined it with our historical breach dataset for the last six months (Sep '15 through March ‘16).
Critical Data Point: Leaked Passwords as a Trailing Breach Indicator WHAT’S AT RISK • Access to confidential company resources • Corporate infrastructure
Critical Data Point: Social Engineering • Increased ‘insider’ security incidents • Open to spear phishing campaigns WHAT’S AT RISK • Number of “security” employees • Number of “disgruntled” employees • Indicators of security immaturity MEASURING
SecurityScorecard analyzed 39078 companies, and discovered nearly 3700 companies have experienced end-of-service product issues. Critical Data Point : End-of-life Product Issue
Critical Data Point: End of Life Products Most end of life issues were prevalent in Education, Goverment & Telecom industries. WHAT’S AT RISK • Legacy systems • Unsupported software with critical vulnerabilities blue = with end-of-life issue, orange = without end-of-life issue
Most Prevalent End of Life Products 5 most widely used, unsupported technologies are: • Internet Information Services 6.0 • Internet Information Services 5.1 • Windows XP • Windows Server 2003 • S5000 Series Switches S5624-PWR
End of Life Products More Common in Large Organizations Products no longer supported by the manufacturer are rampant in companies with: • 1001 – 5000 employees • 10,000+ employees
HOW YOUR ENTERPRISE BENEFITS FROM REALTIME VISIBLITY? Prioritize and validate vendor questionnaires, onsite visits, and penetration tests Onboard vendors faster to meet requirements of the business Receive immediate notifications of vendor security degradation Expand third party programs without additional staff, questionnaires, or penetration tests Work with 3rd parties using collaborative workflows to remediate issues and improve security posture
Ali Alwan Regional Director, SecurityScorecard FOR MORE INFORMATION THANK YOU! Address Security Scorecard Inc. 22 W. 19th Street - floor 9 New York, New York 10016