Download
1 / 24
240 likes | 352 Vues
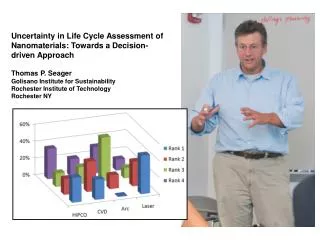
Achieving Emissions Reductions in the Freight Sector: Understanding Freight Flows and Exploring Reduction Options. James J. Winebrake, PhD. Rochester Institute of Technology Presented at the Northeast Association of State Transportation Officials 2012 Conference 12 June 2012.

E N D
Achieving Emissions Reductions in the Freight Sector: Understanding Freight Flows and Exploring Reduction Options James J. Winebrake, PhD. Rochester Institute of Technology Presented at the Northeast Association of State Transportation Officials 2012 Conference 12 June 2012
Acknowledgments • This work was funded in part by a grant from the Transportation and Climate Initiative (TCI) administered by the Georgetown Climate Center. • For more information about TCI see: http://www.georgetownclimate.org/state-action/transportation-and-climate-initiative • I am also grateful to Dr. James Corbett (UD), Dr. Scott Hawker (RIT), and Dr. Karl Korfmacher (RIT) for contributions related to the GIFT model. J. Winebrake (2012)
Overview • Understand the problem • Characterize the data • Identify energy and emissions reduction opportunities • Implement results • Questions and discussion J. Winebrake (2012)
Understand the Problem Freight is closely tied to economic growth and is growing; unfortunately, the bulk of freight is moved by high energy-intensive and GHG-intensive modes (truck). J. Winebrake (2012)
Goods Movement and GDP For every trillion dollar increase in GDP, we expect an additional ~140 billion ton-miles.
J. Winebrake (2012) Source: BTS (2011)
Note: These represent top-down averages and should not be used for blanket modal comparisons! J. Winebrake (2012)
Total emissions from transportation ~1.9 GtCO2eq/yr Total emissions from all energy sectors ~5.9 GtCO2eq/yr J. Winebrake (2012) Source: AEO 2011.
Characterize the Data (Northeast and Mid-Atlantic (TCI) Region) Freight flows for the TCI region are dominated by truck (87%); about 50% of the commodities moved by weight include: gravel and stone; refined fuel; non-metallic minerals; and coal. J. Winebrake (2012)
Overview of Characterization Project • Purpose • Characterize freight flows for the TCI region • Provide EXCEL and ArcGIS datasets on freight flows • Value • Results provide data and context for regional plans, programs, and policies to reduce improve efficiency and reduce the environmental impacts from freight transportation • Supported by the Georgetown Climate Center J. Winebrake (2012)
Scope of Study • Geography • Connecticut, Delaware, District of Columbia, Maine, Maryland, Massachusetts, New Hampshire, New Jersey, New York, Pennsylvania, and Vermont. • Modes: Truck, Rail, Ship • Commodities: All available and reported J. Winebrake (2012)
Freight Flow (ktons) to Northeast Counties from the Northeast Region J. Winebrake (2012)
Freight Flow to Northeast Counties from U.S. States Outside of the Northeast Region, by Weight J. Winebrake (2012)
Identify Energy and Emissions Reduction Opportunities The IF-TOLD framework provides insights into options for emissions reductions from freight; the GIFT model can be used to evaluate trade-offs across important criteria (cost, time-of-delivery, emissions, etc.). J. Winebrake (2012)
The IF-TOLD Mitigation Framework • The IF-TOLD framework: • Intermodalism/Infrastructure– use of efficient modes and infrastructure • Fuels – use of low carbon fuels • Technology – application of efficient technologies • Operations – best practices in operator behavior • Logistics – improve supply chain management • Demand – reduce how much STUFF we consume J. Winebrake (2012)
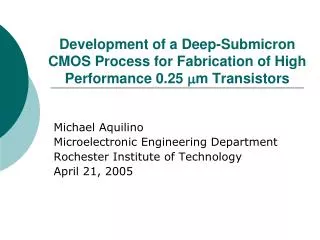
Example Using the Geospatial Intermodal Freight Transportation (GIFT) Model GIFT has been jointly developed at the Rochester Institute of Technology (RIT) and the University of Delaware with partial support from the U.S. Department of Transportation, Maritime Administration and the Great Lakes Maritime Research Institute. J. Winebrake (2012)
Connect Multiple Transportation Mode Networks at Intermodal Transfer Facilities Road Network Rail Network Intermodal Transfer Facility Waterway Network J. Winebrake (2012)
Montreal to Cleveland (Ship 1) Montreal to Cleveland (Ship 2)
Implement Results More analysis of policy impacts needed for the Northeast and Mid-Atlantic states; however, one could use IF-TOLD to identify potential opportunities for a menu of policies . J. Winebrake (2012)
Policy Options J. Winebrake (2012)
Questions/Discussion J. Winebrake (2012)