Download
1 / 17
170 likes | 423 Vues
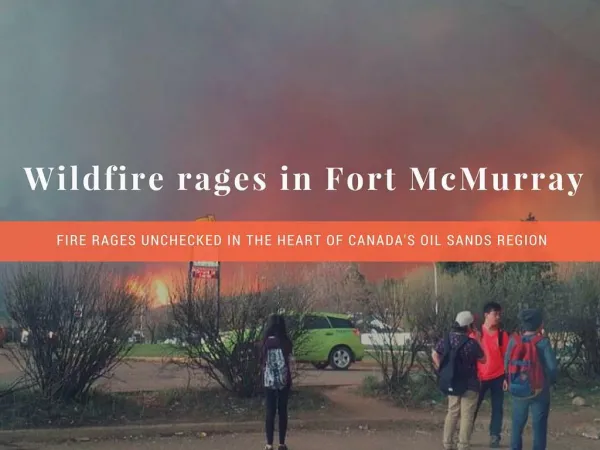
Oil Sands: An Industry Overview Presented by: Jacob Irving, Executive Director OSDG Presented to: Fort McMurray Rotary Club Date: January 28, 2009. Athabasca Deposit Region – Status of Proposed Oil Sands Projects Under Construction/Approved/Application (Jan. 2009).

E N D
Oil Sands: An Industry OverviewPresented by: Jacob Irving, Executive Director OSDG Presented to: Fort McMurray Rotary Club Date: January 28, 2009
Athabasca Deposit Region – Status of Proposed Oil Sands Projects Under Construction/Approved/Application (Jan. 2009) • Total potential bitumen production for projects currently: • Under construction – 269,500 bpd • Under ERCB approval – 1,259,000 • bpd • Under regulatory application – • 1,600,000 bpd Data source: Strategy West Jan. 2009
2008 Oil Sands Bitumen Production Forecast1 • Continues to grow to 5M bbl/day, consistent with past forecasts Mining Insitu 1Bitumen forecast for all Alberta oil sands projects – all announced case Source: CAPP and Nichols Applied Management
Despite setbacks, oil sands production expected to increase1 Actual Bitumen Production Original Estimated Bitumen Production (Jan 08) Adjusted Estimated Bitumen Production (Dec 08) 1Bitumen forecast for all Alberta oil sands projects – original estimate (January 2008) and adjusted estimate per public announcements (December 2008) Source: CAPP and Nichols Applied Management 3
Combined Oil Sands Industry Expenditure Forecast1 • 2008 capex and opex spending double that of 2006 • 2008 capex forecast higher than 2007 forecast Actual Forecast Construction Capital Operating Costs 12008 construction capital expenditure forecast for all Alberta oil sands projects, including related pipeline, upgrader and co-generation projects – all announced case. 2008 operating expenditure study. Source: Construction Capital: CAPP and Nichols Applied Management, Operating Expenditure – Nichols Study
Combined oil sands expenditures: historical and estimated1 Cap ex: $15.3 Billion Op ex: $18.2 Billion Actual Construction Capital Expenditures Original Estimated Construction Capital Expenditures (Jan 08) Actual Operating Expenditures Original Estimated Operating Expenditures (Jan 08) Adjusted Estimated Construction Capital Expenditures (Dec 08) Adjusted Estimated Operating Expenditures (Dec 08) 12008 construction capital expenditure estimate for all Alberta oil sands projects, including related pipeline, upgrader and co-generation projects – original estimates (Jan 2008) and adjusted (December 2008) per public announcements. Source: Construction Capital: CAPP and Nichols Applied Management, Operating Expenditure – Nichols Study 5
Forecast of New Permanent Operations Jobs in the Wood Buffalo Region - continues to track previous projections • Paralleling growth in bitumen production and driving urban population growth • Excludes the over 27,000 current construction workforce • For every permanent operations job: 3 jobs created locally, and 6 nationally1 Cumulative growth, new permanent operations jobs only - does not include construction jobs 1998 - 6,600 people directly employed by oil sands 2007 - Over 5,000 new jobs, nearly double 1998 jobs 2012 - 13,700 new jobs, triple 1998 jobs Actual Forecast 1Source: Nichols Applied Management Note: 2007 data subject to verification
2007 Urban Population Forecast • Excludes the over 27,000 workers currently in work camps and hotel/motels and anticipates an 8%/yr growth through 2010 Fort McMurray urban service area/Saprae Creek. Adjusted for 2007 RMWB census OSDG’s population forecast process has been approved by a third party audit performed by Deloitte Touche Average annual population increase of 9% over past 7 years with 8% expected through to 2010 Source: Nichols Applied Management
OSDG Members continue to invest significantly in the community $12 million donated in 2007 within the RMWB and $11.5 million in 2006 including: $2.5 million to MacDonald Island recreation facility $2.5 million to Timberlea Athletic Park $750,000 donation to MRI campaign $200,000 to Leadership Wood Buffalo Ongoing support for key community service organizations including: United Way (Fort McMurray is per capita leader in Canada) Keyano College Northern Lights Regional Health Centre YMCA of Wood Buffalo Day Care More than $52 million donated over the past 10 years.
Aboriginal participation and opportunities in oil sands development are substantial • Aboriginal Companies – value of contracts in 2007 - $606 million • Aboriginal Companies – value of contracts 1998 – 2007 - $2.6 billion • Aboriginal employees in permanent jobs in 2007 – 1,500+ • Contributions to Aboriginal communities in 2007 - $3.6 million • Athabasca Tribal Council APCA funding 2007 - $1.6 million • Industry Relations Corporations funding 2007 - $8 million
Announced Infrastructure Funding 2005 – 2008 for Regional Municipality of Wood Buffalo
Environment - Water • Total Annual Net Water Allocation of the Athabasca River represents less than 3.2% of flow, compared to: • 37% North Saskatchewan River (Edmonton) • 60% Oldman River (Southern Alberta) • 65% Bow River (Calgary) • Oil sands industry net water allocation is 2.2% of flow • Industry has consistently used less than its allocated amount • There has been a decrease in the overall amount of water used in mining over the past 30 years of oil sands development. • Saline/brackish water use in in-situ operations is the norm • Oil sands mining operations recycle more than 80% of the fresh water used. Cooling tower evaporation accounts for 30% of any lost water which is returned to the hydrologic cycle. • Intense sampling of water reveals no change in naturally occurring contaminants from oil sands development. • Industry is constantly researching ways to further reduce water use. It makes sense from an environmental, social and business perspective.
Environment - Air • The oil sands industry has reduced NOx and SO2 emissions on a per barrel basis since the beginning of oil sands production • Air quality in the Fort McMurray Wood Buffalo region rated “good” or better nearly 90% of the time, consistently higher than major cities like Toronto, Montreal, Vancouver, Calgary and Edmonton • The Wood Buffalo Environmental Association (WBEA) operates 14 active and 14 passive air monitoring stations with real time air quality data available via the internet 24/7 http://www.wbea.org/content/view/56/111/ • The Oil Sands currently account for 5% of Canada’s Greenhouse Gas (GHG) emissions or 0.1% of global emissions • Barring significant change, the Oil Sands could grow to 8% of Canada’s GHG emissions by 2015 • From a full life cycle or Wells to Wheels perspective, production methods account for approximately 15% of the total carbon output from an Oil Sands barrel. The majority of the carbon is produced by end use combustion.
Canada’s Oil Sands currently account for less than 5% of Canada’s GHG emissions or ~ 1/10th of 1% of global total Environment - Greenhouse Gases (GHG) Source: CAPP 13 13
GHG emissions: “From Wells to Wheels” 6,000 5,000 4,000 3,000 kg CO2E/1000L fuel 2,000 1,000 0 Brent Canadian Saudi Light* North Oil Sands Venezuela* Nigerian Light American Forcados* Import Crude Basket Combustion Transportation Refining Production Oil Sands production vs. other sources (full cycle basis) Source: T.J. McCann & Assoc. & OSDG - 2001 14 14
Wood Buffalo - Major Regional Challenges • Uncertain economic climate • Environmental issues • Industry has consistently reduced water use, GHG, SO2 andNOx emissions on a per barrel basis • Industry is strongly monitored and regulated • New technology is constantly researched and applied • Industry needs to improve communication • Aboriginal relations – maintain and increase opportunities • Demand on infrastructure i.e. housing, transportation, utilities, health care • Skilled labour availability – recruitment and retention
Disclaimer This presentation contains forward-looking information. Actual results could differ materially due to market conditions, changes in law or government policy, changes in operating conditions and costs, changes in project schedules, operating performance, demand for oil and gas, commercial negotiations or other technical and economic factors. For more information contact: The Oil Sands Developers Group 613A – 8600 Franklin Avenue Fort McMurray, AB T9H 4G8 Canada Ph: 780-790-1999 E-mail: info@oilsandsdevelopers.ca 16


![EVM System Surveillance Presented By: [NAMES] Presented to: [GROUP]](https://cdn0.slideserve.com/294105/slide1-dt.jpg)