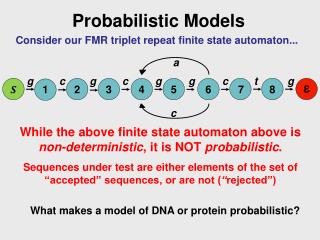
Probabilistic graphical models
Probabilistic graphical models. Probabilistic graphical models. Graphical models are a marriage between probability theory and graph theory (Michael Jordan, 1998) A compact representation of joint probability distributions. Graphs


Probabilistic graphical models
E N D
Presentation Transcript
Probabilistic graphical models • Graphical models are a marriage between probability theory and graph theory (Michael Jordan, 1998) • A compact representation of joint probability distributions. • Graphs • nodes: random variables (probabilistic distribution over a fixed alphabet) • edges (arcs), or lack of edges: conditional independence assumptions
Classification of probabilistic graphical models Both directed and undirected arcs:chain graphs
Bayesian Network Structure • Directed acyclic graph G • Nodes X1,…,Xn represent random variables • G encodes local Markov assumptions • Xi is independent of its non-descendants given its parents A B C D E F G
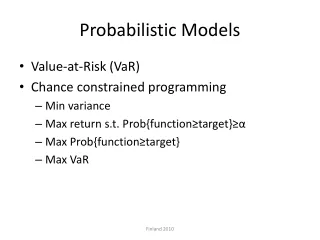
Bayesian Network • Conditional probability distribution (CPD) at each node • T (true), F (false) • P(C, S, R, W) = P(C) * P(S|C) * P(R|C,S) * P(W|C,S,R) P(C) * P(S|C) * P(R|C) * P(W|S,R) • 8 independent parameters
Training Bayesian network: frequencies Known: frequencies Pr(c, s, r, w) for all (c, s, r, w)
Application: Recommendation Systems • Given user preferences, suggest recommendations • Amazon.com • Input: movie preferences of many users • Solution: model correlations between movie features • Users that like comedy, often like drama • Users that like action, often do not like cartoons • Users that like Robert Deniro films often like Al Pacino films • Given user preferences, can predict probability that new movies match preferences
Application: modeling DNA motifs • Profile model: no dependences between positions • Markov model: dependence between adjacent positions • Bayesian network model: non-local dependences
1 2 3 4 5 6 A1 A2 A3 A4 A5 A6 A DNA profile TATAAA TATAAT TATAAA TATAAA TATAAA TATTAA TTAAAA TAGAAA 1 2 3 4 5 6 T 8 1 6 1 0 1 C 0 0 0 0 0 0 A 0 7 1 7 8 7 G 0 0 1 0 0 0 The nucleotide distributions at different sites are independent !
m4 m2 m1 m5 11 15 14 12 Mixture of profile model A1 A3 A4 A5 A6 A2 Z The nt-distributions at different sites are conditionally independent but marginally dependent !
1 2 3 4 5 6 A1 A2 A3 A4 A5 A6 Tree model The nt-distributions at different sites are pairwisely dependent !
Undirected graphical models (e.g. Markov network) • Useful when edge directionality cannot be assigned • Simpler interpretation of structure • Simpler inference • Simpler independency structure • Harder to learn
Markov network • Nodes correspond to random variables • Local factor models are attached to sets of nodes • Factor elements are positive • Do not have to sum to 1 • Represent affinities A C B D
Markov network • Represents joint distribution • Unnormalized factor • Partition function • Probability A C B D
Markov Network Factors • A factor is a function from value assignments of a set of random variables D to real positive numbers • The set of variables D is the scope of the factor • Factors generalize the notion of CPDs • Every CPD is a factor (with additional constraints)
Maximal cliques • {A,B} • {B,C} • {C,D} • {A,D} Maximal cliques • {A,B,C} • {A,C,D} Markov Network Factors A A B D B D C C
Pairwise Markov networks • A pairwise Markov network over a graph H has: • A set of node potentials {[Xi]:i=1,...n} • A set of edge potentials {[Xi,Xj]: Xi,XjH} • Example: Grid structured Markov network X11 X12 X13 X14 X21 X22 X23 X24 X31 X32 X33 X34
Application: Image analysis • The image segmentation problem • Task: Partition an image into distinct parts of the scene • Example: separate water, sky, background
Markov Network for Segmentation • Grid structured Markov network • Random variable Xi corresponds to pixel i • Domain is {1,...K} • Value represents region assignment to pixel i • Neighboring pixels are connected in the network • Appearance distribution • wik – extent to which pixel i “fits” region k (e.g., difference from typical pixel for region k) • Introduce node potential exp(-wik1{Xi=k}) • Edge potentials • Encodes contiguity preference by edge potentialexp(1{Xi=Xj}) for >0
Markov Network for Segmentation Appearance distribution • Solution: inference • Find most likely assignment to Xi variables X11 X12 X13 X14 X21 X22 X23 X24 X31 X32 X33 X34 Contiguity preference