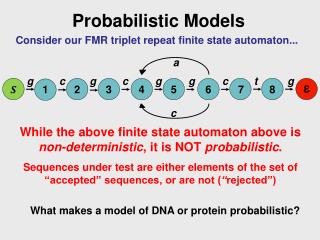
Probabilistic Models
Explore Value-at-Risk calculation methods and optimization models in Finland 2010, focusing on risk management in finance with a detailed look at scenarios, approaches, and solutions.


Probabilistic Models
E N D
Presentation Transcript
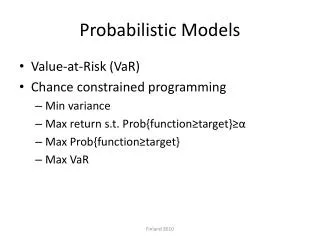
Probabilistic Models • Value-at-Risk (VaR) • Chance constrained programming • Min variance • Max return s.t. Prob{function≥target}≥α • Max Prob{function≥target} • Max VaR Finland 2010
Value at Risk Maximum expected loss given time horizon, confidence interval Finland 2010
VaR = 0.64expect to exceed 99% of time in 1 yearHere loss = 10 – 0.64 = 9.36 Finland 2010
Use • Basel Capital Accord • Banks encouraged to use internal models to measure VaR • Use to ensure capital adequacy (liquidity) • Compute daily at 99th percentile • Can use others • Minimum price shock equivalent to 10 trading days (holding period) • Historical observation period ≥1 year • Capital charge ≥ 3 x average daily VaR of last 60 business days Finland 2010
VaR Calculation Approaches • Historical simulation • Good – data available • Bad – past may not represent future • Bad – lots of data if many instruments (correlated) • Variance-covariance • Assume distribution, use theoretical to calculate • Bad – assumes normal, stable correlation • Monte Carlo simulation • Good – flexible (can use any distribution in theory) • Bad – depends on model calibration Finland 2010
Limits • At 99% level, will exceed 3-4 times per year • Distributions have fat tails • Only considers probability of loss – not magnitude • Conditional Value-At-Risk • Weighted average between VaR & losses exceeding VaR • Aim to reduce probability a portfolio will incur large losses Finland 2010
Optimization Maximize f(X) Subject to: Ax ≤ b x ≥ 0 Finland 2010
Minimize VarianceMarkowitz extreme Min Var [Y] Subject to: Pr{Ax ≤ b} ≥ α ∑ x = limit = to avoid null solution x ≥ 0 Finland 2010
Chance Constrained Model • Maximize the expected value of a probabilistic function Maximize E[Y] (where Y = f(X)) Subject to: ∑ x = limit Pr{Ax ≤ b} ≥ α x ≥ 0 Finland 2010
Maximize Probability Max Pr{Y ≥ target} Subject to: ∑ x = limit Pr{Ax ≤ b} ≥ α x ≥ 0 Finland 2010
Minimize VaR Min Loss Subject to: ∑ x = limit Loss = initial value - z1-α √[var-covar] + E[return] where z1-α is in the lower tail, α= 0.99 x ≥ 0 • Equivalent to the worst you could experience at the given level Finland 2010
Demonstration Data Finland 2010
Maximize Expected Value of Probabilistic Function • The objective is to maximize return: Expected return = 0.148 S + 0.060 B + 0.152 G • subject to staying within budget: Budget = 1 S + 1 B + 1 G ≤ 1000 Pr{Expected return ≥ 0} ≥ α S, B, G ≥ 0 Finland 2010
Solutions Finland 2010
Minimize Variance Min 0.014697S2 + 0.000936SB - 0.004444SG + 0.000155B2 - 0.000454BG + 0.160791G2 st S + B + G 1000 budget constraint 0.148 S + 0.06 B + 0.152 G ≥ 50 • S, B, G ≥ 0 Finland 2010
Solutions Finland 2010
Max Probability Finland 2010
Real Stock Data – Student-t fit Finland 2010
Logistic fit Finland 2010
Daily Data: Gains Finland 2010
Results Finland 2010