Advanced Probabilistic Models for Value-at-Risk and Capital Adequacy Optimization
This document explores probabilistic models in finance, focusing on Value-at-Risk (VaR) metrics critical for capital adequacy under the Basel Capital Accord. It presents methods for maximizing returns while adhering to constraints such as loss probabilities and budgets. Through chance-constrained programming and various calculation approaches like historical simulation and Monte Carlo methods, we examine how to effectively manage risk and ensure liquidity. Examples and solutions tailored to real stock data are included to illustrate practical applications of the theories discussed.

Advanced Probabilistic Models for Value-at-Risk and Capital Adequacy Optimization
E N D
Presentation Transcript
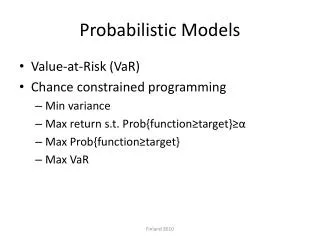
Probabilistic Models • Value-at-Risk (VaR) • Chance constrained programming • Min variance • Max return s.t. Prob{function≥target}≥α • Max Prob{function≥target} • Max VaR Finland 2010
Value at Risk Maximum expected loss given time horizon, confidence interval Finland 2010
VaR = 0.64expect to exceed 99% of time in 1 yearHere loss = 10 – 0.64 = 9.36 Finland 2010
Use • Basel Capital Accord • Banks encouraged to use internal models to measure VaR • Use to ensure capital adequacy (liquidity) • Compute daily at 99th percentile • Can use others • Minimum price shock equivalent to 10 trading days (holding period) • Historical observation period ≥1 year • Capital charge ≥ 3 x average daily VaR of last 60 business days Finland 2010
VaR Calculation Approaches • Historical simulation • Good – data available • Bad – past may not represent future • Bad – lots of data if many instruments (correlated) • Variance-covariance • Assume distribution, use theoretical to calculate • Bad – assumes normal, stable correlation • Monte Carlo simulation • Good – flexible (can use any distribution in theory) • Bad – depends on model calibration Finland 2010
Limits • At 99% level, will exceed 3-4 times per year • Distributions have fat tails • Only considers probability of loss – not magnitude • Conditional Value-At-Risk • Weighted average between VaR & losses exceeding VaR • Aim to reduce probability a portfolio will incur large losses Finland 2010
Optimization Maximize f(X) Subject to: Ax ≤ b x ≥ 0 Finland 2010
Minimize VarianceMarkowitz extreme Min Var [Y] Subject to: Pr{Ax ≤ b} ≥ α ∑ x = limit = to avoid null solution x ≥ 0 Finland 2010
Chance Constrained Model • Maximize the expected value of a probabilistic function Maximize E[Y] (where Y = f(X)) Subject to: ∑ x = limit Pr{Ax ≤ b} ≥ α x ≥ 0 Finland 2010
Maximize Probability Max Pr{Y ≥ target} Subject to: ∑ x = limit Pr{Ax ≤ b} ≥ α x ≥ 0 Finland 2010
Minimize VaR Min Loss Subject to: ∑ x = limit Loss = initial value - z1-α √[var-covar] + E[return] where z1-α is in the lower tail, α= 0.99 x ≥ 0 • Equivalent to the worst you could experience at the given level Finland 2010
Demonstration Data Finland 2010
Maximize Expected Value of Probabilistic Function • The objective is to maximize return: Expected return = 0.148 S + 0.060 B + 0.152 G • subject to staying within budget: Budget = 1 S + 1 B + 1 G ≤ 1000 Pr{Expected return ≥ 0} ≥ α S, B, G ≥ 0 Finland 2010
Solutions Finland 2010
Minimize Variance Min 0.014697S2 + 0.000936SB - 0.004444SG + 0.000155B2 - 0.000454BG + 0.160791G2 st S + B + G 1000 budget constraint 0.148 S + 0.06 B + 0.152 G ≥ 50 • S, B, G ≥ 0 Finland 2010
Solutions Finland 2010
Max Probability Finland 2010
Real Stock Data – Student-t fit Finland 2010
Logistic fit Finland 2010
Daily Data: Gains Finland 2010
Results Finland 2010