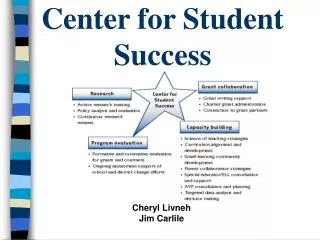
Success For Every Student 2011
Success For Every Student 2011. Montgomery County Public Schools, Maryland. Who We Are. 144,000 Students 22,000 employees 23.5 million ft 2 of building space 13 million meals served each year Our buses travel two and a half times around the equator every day. WHO WE ARE.

Success For Every Student 2011
E N D
Presentation Transcript
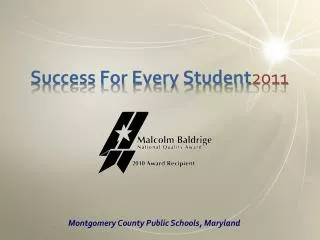
Success For Every Student2011 Montgomery County Public Schools, Maryland
Who We Are • 144,000 Students • 22,000 employees • 23.5 million ft2 of building space • 13 million meals served each year • Our buses travel two and a half times around the equator every day
WHO WE ARE • Students from 164 countries speaking 134 languages • 17,000 students with special needs • 18,000 students participate in ESOL • $2.1 billion operating budget • 16th largest school system in the U.S.
Baldrige in Education Initiative ►The National Alliance of Businesses (NAB) ► American Productivity and Quality Center ► Partnership with twenty-six leading business and education organizations ► Reform education based on quality principles ► Goals 2000 Grants awarded to states who applied
Expectations YOU WANT ME TO DO WHAT BY WHEN?
How Do We Do It? • People • Plan • Processes • Persistence © 2011 Montgomery County Public Schools
Key Questions • What do the data tell us? • Where are we missing the mark? • What do we need to do about it? © 2011 Montgomery County Public Schools
What Do the Data Tell Us? Our demographics are shifting Hispanic 23.3% Asian American 15.7% African American 23.4% White 37.2% 2010 © 2011 Montgomery County Public Schools
ESOL Fewer students Average Most students What Do the Data Tell Us? A tale of two counties MOBILITY FARMS © 2011 Montgomery County Public Schools
What Do the Data Tell Us? Outcomes are predictable © 2011 Montgomery County Public Schools
Baldrige Basics Baldrige is a Systematic Process for Making Systemic Change © 2011 Montgomery County Public Schools
Baldrige Basics Alignment Aim of the Organization Goals and Measures Adapted from The Management Compass by Michelle Bechtell Random Acts of Improvement © 2011 Montgomery County Public Schools
Baldrige Basics Alignment Aim of the Organization Goals and Measures Adapted from The Management Compass by Michelle Bechtell Aligned Acts of Improvement © 2011 Montgomery County Public Schools
What Do We Need to Do About It? Alignment of Actions MCPS Vision, Mission, Core Values, Goals and Board of Education’s Academic Priorities No Child Left Behind and Bridge to Excellence Five-Year Comprehensive Master Plan Our Call to Action: Pursuit of Excellence • Office Strategic Plans • Department Plans • Division Plans • Individual Plans • School Strategic Plans • Classroom Plans • PDP’s • Individual Student Plans © 2011 Montgomery County Public Schools
Performance Improvement System DO Implements the processes to address the challenges by capitalizing on core competencies and strategic advantages STUDY PLAN Informs the identification of the strategic challenges and advantages and verifies the core competencies that need to be developed to meet the strategic challenges and student and system needs. Addresses the strategic challenges, developing the core competencies, and capitalizing on the strategic advantages HIGH STUDENT PERFORMANCE Informs planning for addressing new or existing challenges, and identifying additional core competencies and advantages PDSA ACT
Performance Improvement System DO STUDY • Systematic and systemic implementation and integration of approaches, deployment, and learning for all key processes • Systematic and systemic engagement of the workforce • Aligned actions at all levels of the organization • Data collection of levels, trends, comparisons, benchmarks, and integration of formative and summative measures for key processes and OCA data points PLAN • Implement monitoring processes: • Analyze levels, trends, benchmarks of formative and summative process measures and student achievement outcomes, including local, state, and national measures • M-Stat • ELT • OSP monitoring calendar • Surveys of School Environment • Inputs, Guides, Outputs, and Enablers (IGOE) • Charters • Impact analyses • LEAN and Six Sigma • Review outcomes for office, department, and division plans • Review SIP outcomes • Program evaluation and applied research findings • Accuracy of prediction models for student achievement • Action plan results • Project results • OCA strategic planning process • Listening and learning methods • Process Management and Knowledge Transfer • Aligned office, department, and division strategic plans • School improvement plans • Action planning, e.g., human resource action plans • Internal applied research and program evaluation results • External research knowledge transfer • Professional development • Budget planning and resource allocation • Design work systems HIGH STUDENT PERFORMANCE • Transfer and share knowledge • Refine or redesign work systems • Refine or redesign key processes • Refine or redesign strategic plans • Refine or redesign strategic planning process PDSA Examples ACT Organizational Profile
Strategic Planning Process • Step 1: PLAN Process Improvement Validate the Need for Improvement and Clarify Purpose • Step 2: DO Align Action at all Levels of the Organization Redesign Refine Redeploy Step 3: STUDY Analyze Formative and Summative Results Step 4: ACT Continuous Improvement Evaluate the Process, Make Adjustments, Repeat the Cycle
Strategic Planning Process • Step 1: PLAN • ASSESS ORGANIZATIONAL PERFORMANCE • REVIEW/REFINE VISION, MISSION, CORE VALUES, PRIORITIES • DEVELOP GOALS, MEASURES, STRATEGIC OBJECTIVES • OFFICE, DEPARTMENT, DIVISIONS, SCHOOLS, DEVELOP STRATEGIC PLANS AND ACTION PLANS ALIGNED WITH THE SYSTEM’S PLAN Process Improvement • Step 2: DO • Strategic and action plans are deployed Redesign Refine Redeploy Step 3: STUDY • Board, ELT, central leaders, principals, teachers - monitor , review, evaluate progress; recommend course corrections As needed Step 4: ACT • Focus on opportunities for improvement based on assessments • Redefine and redesign system, office, department and school goals and action plans • Redirect and redeploy resources to address opportunities for improvement Evaluate the Process, Make Adjustments, Repeat the Cycle
Compliance vs. Commitment Baldrige Guided School Improvement Planning Process
Baldrige Criteria for Performance Excellence Leadership Strategic Planning Goals & Measures Customer Focus Results Workforce Focus Process Management Measurement, Analysis, and Knowledge Management BALDRIGE CRITERIA
Baldrige Quality Academies ►Three academies, two at the elementary level and one at the secondary level, were developed ►The purpose of the academies was to help teachers understand how to use quality principles with students ►Approximately 7,000 teachers visited an academy during a four year period of time ►Attendees rated their satisfaction level at 98%.
My Job, Your Job, Our Job A Handbook for Teachers Building a Classroom Learning System © 2011 Montgomery County Public Schools
Accountability and Improvement System Goals Accountability System Improvement System Results Outcomes Processes • Stakeholders/ • Customers • Students • Parents • Faculty • Administrators • School Board • State and federal • Community • Taxpayers • Employers • Measures • Cost • Time • Value Added • Quality • Productivity • Customer Satisfaction • Waste • Measures • Test Scores • Graduation Rates • Achievement gap • AYP • Attendance © 2011 Montgomery County Public Schools
MCPS Recognition MCPSwas a finalist for the $2 million Broad Prize for Urban Education “Montgomery County’s distinction as a Broad Prize finalist demonstrates its unwavering focus on strong, sustainable student achievement” “It is our hope that school districts around the country will learn from the practices Montgomery County and other finalists are employing that are leading to impressive academic gains.” Eli Broad Founder, The Broad Foundation © 2011 Montgomery County Public Schools
MCPS Recognition MCPS is a 2010 Malcolm Baldrige National Quality Award Recipient © 2011 Montgomery County Public Schools
SO WHAT? SHOW ME THE DATA HOW DO YOU KNOW?
Note: Only 39 percent of Kindergarteners could read at Text Level 3in 2001.
MSA Grade 3 ReadingGap Shrinks by 29 Percentage Points Percent Proficient or Higher
MSA Grade 3 MathGap Shrinks by 16 Percentage Points Percent Proficient or Higher
MSA Grade 5 ReadingGap Shrinks 24 Percentage Points Percent Proficient or Higher
MSA Grade 5 MathGap Shrinks 17 Percentage Points Percent Proficient or Higher
SAT Participation and Performance MCPS Class of 2010 Sets District Record Percent Taking the SAT Mean Combined SAT Score (2010) (2010) (2010) (2009) (2010) © 2011 Montgomery County Public Schools
SAT Participation and Performance MCPS Hispanic Students—Class of 2010 Mean Combined SAT Score © 2011 Montgomery County Public Schools
SAT Participation and Performance MCPS African American Students—Class of 2010 Mean Combined SAT Score © 2011 Montgomery County Public Schools
College Ready: A Decade of AP Growth Number of AP Exams Taken by All MCPS Students Up 4.4% since last year
College Ready: A Decade of AP Growth Number of AP Exams Scoring 3 or Higher Up 3.7% since last year
AP Participation and Performance National, Maryland, and MCPS Class of 2010 Percent Taking an AP Exam Percent of AP Exams with Score of 3 or Higher Public School Students, Class of 2010
Percentage of AP Exams Scoring 3 or Higher All Students - 2010
AP Participation and Performance MCPS African American Graduates 2010 National Participation All Students 28.3% 2010 National Performance All Students 16.9% 2010 National Performance African American Students 4.5%
AP Participation and Performance MCPS African American Male Graduates 2010 National Participation All Students 28.3% 2010 National Performance All Students 16.9% 2010 National Performance African American Students 4.5%
AP Participation and Performance • MCPS Hispanic Graduates PERCENT 2010 National Participation All Students 28.3% 2010 National Performance All Students 16.9% Hispanic Students 14.7%
AP Participation and Performance • MCPS Hispanic Male Graduates 2010 National Participation All Students 28.3% 2010 National Performance All Students 16.9% Hispanic Students 14.7%
MCPS Graduates Who Earned a 4-Year College Degree 2001-2004