Download

1 / 18
180 likes | 306 Vues
Evidence of North American CO 2 sources and sinks from regional observations during INTEX-A. S. Vay, Y. Choi, J.-H. Woo, K. Prasad, R. Washenfelder, P. Wennberg, S. Nolf, A. Aknan, J. Barrick, S. Branham, C. Hudgins, J. Plant. DC-8 (2004/07/20).

E N D
Evidence of North American CO2 sources and sinks from regional observations during INTEX-A S. Vay, Y. Choi, J.-H. Woo, K. Prasad, R. Washenfelder, P. Wennberg, S. Nolf, A. Aknan, J. Barrick, S. Branham, C. Hudgins, J. Plant
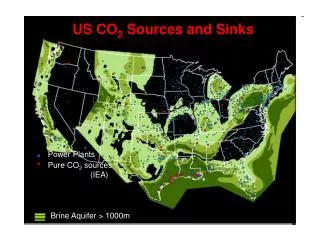
DC-8 (2004/07/20) High CO2 (> 1Std) Long-range transport? Low CO2 (< 1Std) Uptake from vegetation? The white bar : Point sources extruded by July CO2 emission A narrow point source plume was captured by high resolution CO2 sensor (403.15 ppm CO2 @ 1Hz)
CO2 ANALYSIS AT LEVEL 1 CLASSES (AG. vs NON-AG) Flight path overlay on LANDSAT map and Aircraft based CO2 data aggregated at 7.5 minute Quadrangles for LEVEL 1 classes.
CO2 ANALYSIS AT LEVEL II CLASSES Flight path overlay and Aircraft based CO2 data aggregated at 7.5 minute Quadrangles for LEVEL II classes.
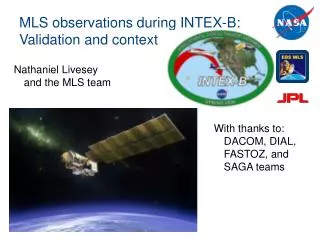
Calibration of Absolute Column CO2 Using Aircraft Data Intercontinental Chemical Transport Experiment – North America (INTEX-NA) • NASA DC-8 and King Air measured in situ CO2 during tower profiles • Eight unique aircraft profiles: DC-8: July 12, July 15 (twice) King Air: July 14, July 15, August 14, August 15 (twice) Allows us to place our column CO2 retrievals on the same scale as the in situ network. DC-8 Flight Path and Photograph from 12 July:
FTS Column and Aircraft In Situ Data – 12 July 04 AIRCRAFT PROFILE: FTS RETRIEVAL: Aircraft Column / Total Dry Column = 373.11 ± 0.52 ppmv FTS Column / Total Dry Column = 376.07 ± 0.24 ppmv
OCO – S. Denning (CSU); H. Boesch (JPL) • AIRS – C. Crevoisier (LSCE); M. Chahine (JPL) • SCIAMACHY – M. Buchwitz (U. Bremen); I. Aben (SRON)