Download
1 / 32
320 likes | 340 Vues
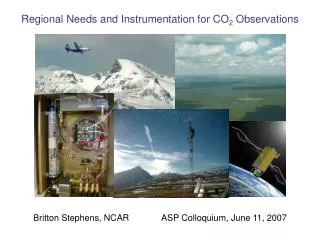
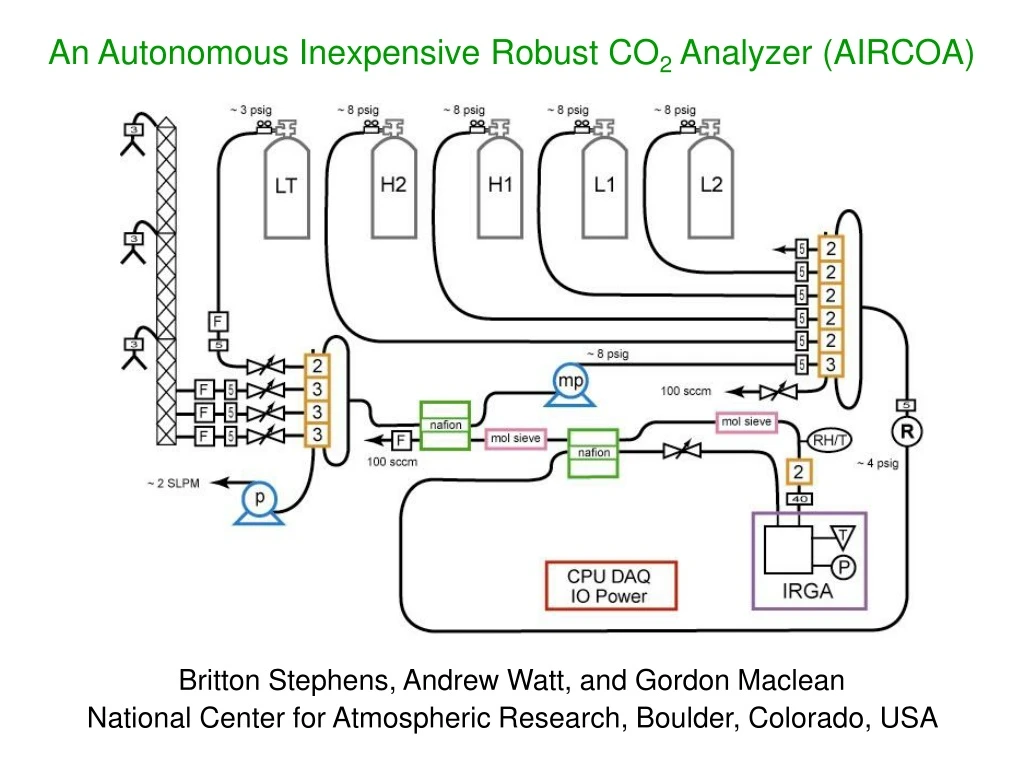
An Autonomous Inexpensive Robust CO 2 Analyzer (AIRCOA). Britton Stephens, Andrew Watt, and Gordon Maclean National Center for Atmospheric Research, Boulder, Colorado, USA. NCAR CO 2 and O 2 /N 2 Calibration Facility. CO 2 signal averaged over 2.5 min. measurement cycle.

E N D
An Autonomous Inexpensive Robust CO2 Analyzer (AIRCOA) Britton Stephens, Andrew Watt, and Gordon Maclean National Center for Atmospheric Research, Boulder, Colorado, USA
Empirical temperature correction SPL 9/4-9/18 NWR 9/18
Drying system monitoring A change of 0.5% RH is approximately 300 ppm H2O, which would cause a dilution error of 0.1 ppm in CO2
Nafion absorption effect Flow pulled through Nafion went from 300 to 50 sccm at t = 30 sec
Automated (4- or 8-hourly) leak checks A positive trend of 0.3 kPa/min would be a leak rate of 0.1 sccm which if 100 ppm different would cause a 0.1 ppm bias
Regulator oven tests Three cylinders were in the oven and one (green dots) was not
Laboratory intercomparisons Laboratory offsets less than 0.06 ppm (1-sigma = 0.12 ppm) Field surveillance tanks Field differences from assigned values less than 0.15 ppm (1-sigma = 0.15 ppm)
Automated web-based output http://www.eol.ucar.edu/~stephens/RACCOON