Download
1 / 60
670 likes | 998 Vues
Chapter 18 Body Composition and Nutrition for Health. EXERCISE PHYSIOLOGY Theory and Application to Fitness and Performance, 6th edition Scott K. Powers & Edward T. Howley. Presentation revised and updated by Brian B. Parr, Ph.D. University of South Carolina Aiken. Nutritional Goals.

E N D
Chapter 18Body Composition and Nutrition for Health EXERCISE PHYSIOLOGY Theory and Application to Fitness and Performance, 6th edition Scott K. Powers & Edward T. Howley Presentation revised and updated by Brian B. Parr, Ph.D. University of South Carolina Aiken
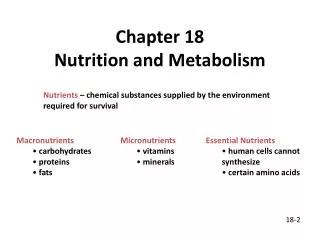
Nutritional Goals • U.S. Dietary Goals (1977) • Increase carbohydrate intake to 55-60% total calories • Decrease fat intake to less than 30% total calories • Decreased saturated fat to less than 10% total calories • Increase polyunsaturated and monounsaturated fat to 10% of caloric intake • Decrease dietary cholesterol to 300 mg per day • Reduce sugar consumption to 15% total calories • Decrease salt intake to 3 grams per day
Nutritional Goals • Institute of Medicine dietary recommendations (2002) • 45–65% calories from carbohydrates • 20–35% calories from fat • 10–35% from protein • Infants and younger children need higher proportion of fat (25–40%)
Nutritional Goals • Dietary Guidelines for Americans (2005) • Consume a variety of nutrient-dense foods and beverages within and among the basic food groups • Choose foods that limit the intake of saturated and trans fats, cholesterol, added sugars, salt, and alcohol • Maintain body weight in a health range • Balance calories from foods and beverages with calories expended • Engage in regular physical activity and reduce sedentary activities
Standards of Nutrition • Dietary Reference Intakes (DRIs) • Quantity of nutrients needed for proper function and health • Recommended Daily Allowances (RDA) • Quantity of each nutrient to meet the needs of nearly all (97–98%) healthy persons • Adequate Intakes (AI) • Recommended daily intake based on apparently healthy people • Tolerable Upper Intake Level (UL) • The highest intake level that is likely to pose no risk • Estimated Average Requirement (EAR) • The intake estimated to meet requirements of half of healthy people
Standards of Nutrition • Estimated Energy Requirement (EER) • Average dietary energy intake predicted to maintain energy balance considering, age, gender, weight, height, and level of physical activity • Daily Value (DV) • Standard used in nutritional labeling • Percentage of recommended intake in each serving • Based on a 2000 kcal•day-1 diet
Nutritional Labeling • Food labels contain: • Serving size information • Total calories and fat calories • Total fat grams, saturated fat grams, cholesterol, and the %DV for each • Based on a 2,000 calorie diet • Total carbohydrate and its sources • Percent of DV for vitamins and minerals • Sodium is given special attention
Example of a Food Label Figure 18.1
Classes of Nutrients—Water • Absolutely essential for life • Loss of only 3-4% body water affects performance • Water loss • Normally ~2500 ml per day • Temperature and exercise can increase water loss to 6-7 liters per day • Water intake • Beverages (1500 ml) • Solid food (750 ml) • Metabolic processes (250 ml) • AI is 2.7 L/day (women), 3.7 L/day (men)
Classes of Nutrients—Vitamins • Fat-soluble vitamins • A, D, E, K • Can be stored in the body • Excess intake can be toxic • Water-soluble vitamins • B vitamins • Thiamin (B-1), riboflavin (B-2), niacin, pyroxidine (B-6), folic acid, B-12, pantothenic acid, biotin, • Involved in energy metabolism • Vitamin C • Maintenance of bone, cartilage, and connective tissue
Major minerals Calcium Sodium Phosphorus Magnesium Sulfur Potassium Chloride Trace elements Iron Iodine Fluoride Zinc Selenium Copper Cobalt Chromium Manganese Molybdenum Arsenic Nickel Vanadium Classes of Nutrients—Minerals
Classes of Nutrients—Minerals • Calcium • Important in teeth and bone structure • Osteoporosis • Iron • Component of hemoglobin • Anemia • Sodium • Associated with hypertension • In sodium-sensitive individuals
Classes of Nutrients—Carbohydrates • Sugars and starches • Contain 4 kcals•gram-1 • Major energy source • Crucial for red blood cells and neurons • Dietary fiber • Non-digestible • Soluble and insoluble forms • Recommendations • Increase dietary fiber and complex carbohydrate intake • Decrease simple sugar intake
Classes of Nutrients—Fats • Dietary fats • Triglycerides • Phospholipids • Cholesterol • Important energy source • Contain 9 kcals•gram-1 • Recommendations • Decrease total fat, saturated fat, and cholesterol intake
Classes of Nutrients—Proteins • Not a major source of energy • 4 kcals•gram-1 • High quality proteins contain the nine essential amino acids • Cannot be synthesized by the body • Most Americans meet protein intake requirements • 0.8 grams•kg-1 body weight • Requirements may be higher in athletes
Meeting the Guidelines and Achieving the Goals • The new Dietary Guidelines for Americans describes a healthy diet as one that: • Emphasizes fruits, vegetables, whole grains, and fat-free or low-fat milk and milk products • Includes lean meats, poultry, fish, beans, eggs, and nuts • Is low in saturated fat, trans fat, cholesterol, salt (sodium), and added sugars
Food Group Plans • MyPyramid (2005) • Revision of 1992 Food Guide Pyramid • Includes major food groups • Grains, vegetables, fruits, milk, and meat & beans • How much of each category to meet 2000 kcal/day energy expenditure • Special attention on physical activity • Website provides individualized dietary plan • Based on age, gender, and level of physical activity
MyPyramid Food Groups Table 18.3
Food Group Plans • Dietary Approaches to Stop Hypertension (DASH) • Developed to prevent hypertension and lower blood pressure in those with hypertension • Healthy eating approach consistent with good health: • Reducing cardiovascular risk factors • Achieving and maintaining a healthy body weight
The DASH Eating Plan Table 18.4
Methods of Assessing Overweight and Obesity • Metropolitan Life Insurance Company’s height/weight tables • Original 1959 tables and 1983 update • Relative weight (RW) • Person’s weight divided by midpoint of medium frame weight range • RW of 1.00 is considered normal • RW of 1.10 (10% above normal) is overweight • RW of 1.20 (20% above normal) is obese • Problems with height/weight tables • High RW could be due to excess fat or muscle
Methods of Assessing Overweight and Obesity • Body mass index (BMI) • Weight (kg) / height (m2) • Classification for adults • Underweight: BMI <18.5 kg/m2 • Normal: BMI 18.5–24.9 kg/m2 • Overweight: BMI 25.0–29.9 kg/m2 • Obesity: BMI ≥30.0 kg/m2 • No way to tell actual body composition • A very muscular person could be classified as obese
Methods of Measuring Body Composition • Isotope dilution • Measurement of total body water • Uses an isotope of water • Photon absorptiometry • Determines mineral content and density of bones • Potassium-40 • Measurement of lean tissue • Hydrostatic (underwater) weighing • Determination of body density • Dual energy X-ray absorptiometry • Estimates lean tissue, bone, mineral, and fat
Methods of Measuring Body Composition • Near infrared interactance (NIR) • Uses an infrared light beam • Radiography • Measurement of fat width • Ultrasound • Measures thickness of subcutaneous fat • Nuclear Magnetic Resonance (NMR) • Volumes of specific tissues • Total body electrical conductivity (TOBEC) • Electrical conductivity of lean and fat tissue
Methods of Measuring Body Composition • Bioelectrical impedance analysis (BIA) • Measurement of total body water and fatness • Air displacement plethysmography • Measurement of body density • Skinfold thickness • Estimate of total body fatness
Body Composition Assessment • Four-component model • Mineral, water, protein, and fat • Best estimates of percent fat • Three-component model • Body water, protein + mineral, and fat • Body water + protein, mineral, and fat • Accounts for variations in bone density or body water • Two-compartment model • Fat mass and fat-free mass • Most commonly used method
495 - 450 % body fat = Density Two-Component System of Body Composition • Body divided into fat-free and fat mass • Fat mass • Density = 0.900 • Fat-free mass • Density = 1.100 • Measurement of whole-body density • Underwater weighing • Skinfolds • Equation to convert body density to percent fat • Based on age, gender, and race • Siri equation:
MA M D = = V (MA-MW) - VR - VGI (DW) Underwater Weighing • Density = mass / volume • Measurement of body volume • Subject is submerged in tank of water • Weight of water displaced = loss of weight when submerged (Ma-Mw) • Weight of water displaced is divided by density of water (DW) to calculate volume of water displaced • Volume is corrected for residual lung volume (VR) and gas in intestinal tract (VGI)
The Underwater Weighing Technique Figure 18.2
Skinfolds • Prediction of body density from estimation of subcutaneous fat • Thickness of subcutaneous fat is measured • Specific sites on the body based on age, gender, and race • Body density is calculated using specific equations • Percent body fat calculated from body density
Body Fatness for Health and Fitness • Recommended body fatness • Males • 10-20% • Females • 15-25% • Health concerns above and below these values • Obesity • Anorexia
Obesity • Diseases linked to obesity: • Hypertension • Type 2 diabetes • Coronary heart disease (CHD) • Stroke • Gallbladder disease • Osteoarthritis • Sleep apnea and respiratory problems • Some cancers • Endometrial, breast, prostate, colon • Other health conditions
Obesity • Prevalence of overweight and obesity in U.S. adults • 30.6% are obese (BMI ≥30) • 65.7% are overweight (BMI ≥25) • Includes those classified as obese • Higher in some ethnic groups • 16.5% of U.S. children are overweight • Distribution of body fat is important • Higher risk of CVD with upper body obesity • Waist circumference >102 cm (men) and >88 cm (women) • Waist to hip ratio >0.95 (men) and >0.80 (women)
Fat Cell Size vs. Number and Obesity • 25 billion fat cells in normal-weight individual • 60-80 billion in obese individual • During weight loss • Fat cell size decreases, not fat cell number • Severe obesity (fat mass >30 kg) • Due to increase in fat cell number (hyperplasia) • Less severe obesity • Due to increase in fat cell size (hypertrophy) • Hyperplasia • Associated with greater difficulty losing weight and maintaining weight loss
Relationship Between Fat Cell Size and Fat Cell Number to Total Body Fat Figure 18.3
Causes of Obesity • Genetic factors • Account for about 25% of the transmissible variance for fat mass and percent body fat • Cultural factors • Account for about 30%
Set Point and Obesity • Set point theory • Biological set point for body weight much like the set points for other physiological variables • Physiological set point model • Biological signals provide input to hypothalamus • Blood glucose, lipid stores, weight on feet • Food intake is either increased or decreased to maintain body weight • Cognitive set point model • Cognitive signals about perception of body weight • Influences food intake to maintain body weight
Physiological Set Point Model for Control of Body Weight Figure 18.4
Cognitive Set Point for Control of Body Weight Figure 18.5
change of energy stores energy intake energy expenditure = - rate of change of energy stores rate of change of energy intake rate of change of energy expenditure = - Energy Balance • Static energy balance • Increase intake of 250 kcals•day-1 would lead to 14 pound weight gain over one year • Dynamic energy balance • Increase in energy intake results in increased body weight • Energy expenditure also increases and weight is maintained at a new, higher level • Results in weight gain of only 3.5 pounds in a year
Nutrient Balance • Carbohydrate and protein • Excess intake is oxidized • Body regulates expenditure to match intake • Does not contribute to weight gain • Fat • Excess intake is not necessarily oxidized • Fat expenditure depends on total energy expenditure • Contributes to weight gain
The Food Quotient • Food quotient (FQ) • Indicates the mix of CHO and fat in the meal • 1.00 = 100% CHO • 0.85 = 50% CHO, 50% fat • 0.70 = 100% fat • Respiratory quotient (RQ) • Indicates the mix of CHO and fat oxidized • Similar to FQ
The FQ, RQ, and Nutrient Balance • RQ = FQ • Nutrient balance • RQ/FQ ratio = 1.0 • RQ > FQ • Not oxidizing as much fat as consumed • RQ/FQ ratio > 1.0 • RQ < FQ • Using more fat than is consumed • RQ/FQ ratio < 1.0
Relationship Between the RQ/FQ Ratio and Energy Balance Figure 18.6
Diet and Weight Control • Diets high in fat are linked to obesity • Fat grams contain twice as many calories as carbohydrates • Nutrient balance can most easily be achieved with a low fat diet • Calories count and must be considered! • Adherence to the diet is more important than the type of diet followed • Calories from foods and beverages should be balanced with calories expended • Gradually decrease caloric intake and increase physical activity
Physical Activity for Weight Control • To reduce the risk of chronic disease • 30 minutes of moderate-intensity physical activity on most days of the week • To manage weight and prevent gradual weight gain • 60 minutes of moderate- to vigorous-intensity activity on most days of the week • To sustain weight loss • 60–90 minutes of moderate-intensity physical activity
Energy Expenditure and Weight Control • Basal metabolic rate (BMR) • Rate of energy expenditure under standardized conditions • Supine position, immediately after rising, 12-18 hours following a meal • Similar to resting metabolic rate (RMR) • Represents 60-75% total energy expenditure • Lower in women, declines with age • Related to fat-free mass • Reduced in response to reduced caloric intake (dieting or fasting) • Exercise can maintain BMR
Decrease in Basal Metabolic Rate During Semi-Starvation Figure 18.7
Energy Expenditure and Weight Control • Thermogenesis • “Heat generation” • Thermic effect of feeding • Increased energy expenditure following ingestion of meals • Small part of total energy expenditure • Not predictive of obesity • Brown adipose tissue • Increases heat production in response to norepinephrine and thyroid hormones • “Futile cycles” • Metabolic cycles (Na+/K+ pump activity)
Energy Expenditure and Weight Control • Physical activity and exercise • Includes exercise and occupational physical activity • Accounts for 5-40% total energy expenditure • Depends on activity level • Important in determining obesity • Inverse relationship between physical activity and percent fat • Individuals accumulating more than 10,000 steps per day are more likely to be in “normal” BMI range