Download
1 / 17
170 likes | 284 Vues
Indicators to monitor the effect of nutrients within the Black Sea. THE GLOBAL ENVIRONMENT FACILITY. The Black Sea ..an endangered sea shared by Bulgaria, Georgia, Romania, Russia, Turkey & Ukraine ….a large basin Inhabited by 160 million people from 17 countries.

E N D
Indicators to monitor the effect of nutrients within the Black Sea THE GLOBAL ENVIRONMENT FACILITY
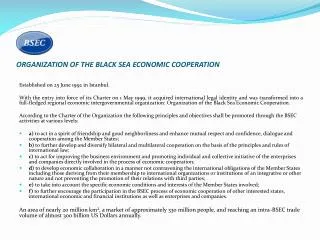
The Black Sea ..an endangered sea shared by Bulgaria, Georgia, Romania, Russia, Turkey & Ukraine ….a large basin Inhabited by 160 million people from 17 countries
GEF/UNDP Assistance to the Wider Black Sea Basin The new GEF assistance is designed to address the three highest priority transboundary problems of the Black Sea (namely eutrophication, discharge of toxic substances including oil, loss of critical benthic habitats and wetlands) and to highlight emerging ones Assistance is provided as three complementary components: • Two Regional Projects for the Black Sea and the Danube River Basin Black Sea project which will be implemented in two Phases between (2002- 2004) and (2004- 2006); • A series of country-related investment projects executed through the World Bank-GEF Nutrient Investment Facility; • Other GEF and donor interventions in the basin targeting reduction of nutrients/toxic pollutants and restoration of critical habitats.
Eutrophication - Summary • Anthropogenic eutrophication is usually caused by nitrogen and/or phosphate compounds either dumped at sea, discharged through pipes, or lost to the marine environment via the atmosphere or run off from land. • Nutrients act as "food" for phytoplankton (plant cells in the water column), capable of multiplying at an enormous rate, given sufficient food and light. This in turn causes a change in the plankton population, a general increase in water turbidity and greater fluctuations in oxygen levels. • As light is prevented from penetrating down, other organisms such as sea weeds (algae) and sea grass can be adversely effected. • Finally with little water movement and a high plankton mass, deoxygenation and mass death of organisms in the affected area may be observed
Strategic Goals for Nutrients in the Black Sea • A long term goal of nutrient reduction to a level which will allow the ecosystem to recover (1960s level); • An intermediate goal not to exceed levels of nutrients above levels encountered in 1997; • To reach agreement on a common methodology for a monitoring approach; • To further assess the nutrient input loads and the ecological status of the Black Sea and the Sea of Azov
Areas of Impact of Nutrients in the Black Sea • The central part of the north-western shelf • biomass reduction of 10 million tons in Phyllophora field from 1950 to 1990 • Seasonal hypoxic zones in front of largest rivers • biological loss of 200 t per square kilometre of seabed. • disappearance of large amounts of surface-living organisms of both of marine and fresh-water origin • Rocky shores • disappearance of epiphyte algae, invertebrates and fish. • Sandy beaches • decrease of polychaetes and bivalves • The open coastal waters • increase in mass species of phytoplankton • Coastal wetlands • decrease of species and increase of hypoxia
Criteria for the Choice of Environmental Status Indicators Consensus- does everybody agree that “less is better”, or vice versa? Responsiveness - will we see comparable figures in the next 5 years? How quickly will changes be detected? Independence of assumptions - could the value change drastically by fumbling with some assumptions? Transparency - can a layperson understand what’s happening? does the indicator hide or reveal facts? Experience - Is the technical capacity available in the region? Is there a significant variability in the historical measurements/ Responsibility - does the indicator point at those who should be held responsible? International standard – has the scientific community at least ring-tested the methodology Analytical soundness - does the indicator measure the problem, or rather something else?
Potential ES Indicators for the Black Sea • Chemical concentrations and loadings in water and sediment • Physical measurements – turbidity related • Biological parameters • micro-algae, macro-algae and higher plants • Invertebrates
Potential ES Indicators for the Black Sea • Chemical loadings to the Black Sea • TP, SRP, TN, TIN, Silicate, BOD • Frequency of measurements required is very high – weekly basis • Continuous flow data • Annual mean load with confidence limits • Total nutrient input important to determine the potential bioavailable load • Chemical concentrations in water column • Bioavailable nutrients (SRP, TIN) and BOD • Trend analysis must include confidence limits • Winter monitoring for nutrients to remove seasonality • Chemical concentrations in sediment • Bioavailable nutrients (SRP, TIN) and BOD in interstitial water • Analysis at specific depths is important – diatoms versus macrophytes • Mineralisation, nitrification and denitrification rates
Potential ES Indicators for the Black Sea • Physical measurements – turbidity related • Secchi disc • Measure of disappearance of disc • Cheap and simple • Suspended solids • May be simple but prone to large variability • Measure of scattered or adsorbed light
The Process of Adoption of ES Indicators • Biological parameters – micro-algae • Primary productivity • Measured as tonne C/ha/year • Standing crop -micro-algal biomass • measured as Chlorophyll-a content • Sampling may miss bloom • Community composition • The development of an index or the identification of indicator species may be best represented only on a single community
The Process of Adoption of ES Indicators • Biological parameters – macro-algae and higher plants • Maximum depth of colonisation • Offers three major advantages over conventional Secchi depth or suspended solids monitoring: • It provides an integrated measure of turbidity over time - perhaps 6 months-2 years. • It provides a genuine measure of the depth of the euphotic zone, not simply a measure of water clarity at a particular depth within the water column. • It is much more ecologically relevant. • Biomass and productivity • Possible problems with storm damage. • number of samples required to detect a significant change in biomass over, say, 5 years,
The Process of Adoption of ES Indicators • Invertebrates – sediment infauna • To be used for monitoring medium-long term (>5 years) recovery of the Black Sea. • Must use harmonized monitoring protocol • The sediment should also be analysed for toxicants (organic and inorganic), particle size analysis and total organic carbon, in addition to water column salinity.
Implementation in the Black Sea Region • Proposal of ES indicators for consultation with the Black Sea Commission’s Advisory groups – Key group: pollution monitoring and assessment • Consultation with the ICPDR and the Black Sea Commission Joint Technical Working Group • Integrate feedback on criteria and weighting • Prioritisation of indicators • Submission to the Black Sea Commission for review • Undertake pilot monitoring programme • - include training, QA/QC and inter-comparison exercise • - agree sampling sites • Collect baseline data • Include ES indicators into the Black Sea Integrated Pollution Monitoring and Assessment Programme (BSIPMAP)
Where are we likely to encounter delay • Agreement of the scientific community • Combat with a proactive approach • Limit the input of non-relevant advisory groups • Quality control – validity of data • Sampling • Analysis • Procedures for assessment of data