Download
1 / 20
260 likes | 908 Vues
SDBS Integrated Spectral Database for Organic Compounds. Sample Search for Chemistry 130 Grace Baysinger and Dr. Dave Keller. SDBS – URL and Description. http://riodb01.ibase.aist.go.jp/sdbs/cgi-bin/cre_index.cgi?lang=eng

E N D
SDBS Integrated Spectral Database for Organic Compounds Sample Search for Chemistry 130 Grace Baysinger and Dr. Dave Keller
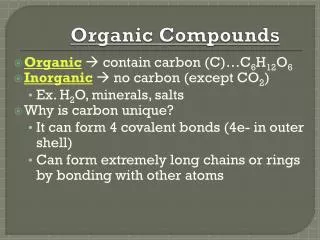
SDBS – URL and Description http://riodb01.ibase.aist.go.jp/sdbs/cgi-bin/cre_index.cgi?lang=eng • SDBS includes 6 different types of spectra under a directory of the compounds. The six spectra are: • Electron impact Mass spectrum (EI-MS), • Fourier transform infrared spectrum (FT-IR) • 1H nuclear magnetic resonance (NMR) spectrum • 13C NMR spectrum • Laser Raman spectrum • Electron spin resonance (ESR) spectrum • It is possible to search by number of atoms, spectral peaks, plus compound name, molecular formula, molecular weight, and CAS Registry Number.
SDBS - Search Form Note: for each peak, a range of values is actually being searched
Spectra Data Search Tips • 13C NMR • Search 13C spectral peaks first as they most closely match your lab data • 1H NMR • Use midpoints of multiplets as spectral peak values • OH peaks for alcohols and acids, and NH peaks for amines may “wander” so your values may not agree with the database • IR • Only include major peaks in IR search; usually < 2800 cm-1
Spectra Data Search Tips • Be sure to omit any peaks due to solvent • For Chem 130, the complete range for a spectral diagram is about: • 13C NMR: 0 to ~220 ppm • IR: ~700 to ~4000 cm-1 • 1H NMR: 0 to ~12 ppm • Add no shift regions (i.e. no peak present) to refine a 13C or 1H NMR search • Review of General Search Strategy • Search spectral peaks using conventions required by search interface • Search 13C NMR first, IR second, and 1H NMR last • Refine using no shift regions for 13C and 1H NMR data • Further refine using heteroatom and/or hydrogen data
SDBS - Tips for Converting Selected Lab Data to Search Strategies
SDBS 13C NMR Search – Peaks, No Shift Regions, and Number of Atoms Use comma with no spaces for multiple peaks. For ranges use space between upper and lower values. Use comma with no spaces for multiple ranges. Peaks=128,129,130,172. No peak region=220 180,110 5 N, F, Cl, Br, I, S, P, Si not present
SDBS - Brief Display of Results Summary of available spectra (Yes/No) Review molecular formulas and eliminate some compounds from further consideration based on heteroatoms present. Remaining compounds can be quickly compared to unknown using 1H, 13C,and IR spectra as well as functional groups listed in name
SDBS IR Search – Peaks and Number of Atoms Peaks = 1688,1454,1327,1294,936,708 N, F, Cl, Br, I, S, P, Si not present
IR Search Results Results on each page are sorted by MW. Use heteroatoms and functional groups in chemical name of to help eliminate candidates.
1H NMR Spectrum of Unknown For multiplets, use midpoints as spectral peak values
SDBS 1H NMR Search – Peaks, No Shift Regions, and Number of Atoms Peaks = 8.12,7.6,7.46 No shift Regions = 11.0 8.5,7.0 0.5 N, F, Cl, Br, I, S, P, Si not present
SDBS – Viewing 1H NMR (90 MHz in CDCl3) for Benzoic Acid Each hydrogen is labeled and assigned to a peak with a given chemical shift in ppm. Click on peak data button for list of individual peaks.