Download
1 / 22
220 likes | 300 Vues
This project aims to integrate ocean observing data to enhance spatial decision support systems for protected species, focusing on cetaceans and anthropogenic threats, such as ship strikes and fishery bycatch. The team utilizes marine habitat modeling, SDSS, and ROMS for nowcast and forecast capabilities in biodiversity and ecological forecasting. The effort includes developing open-source GIS tools and incorporating remotely-sensed data for improved SDSS.

E N D
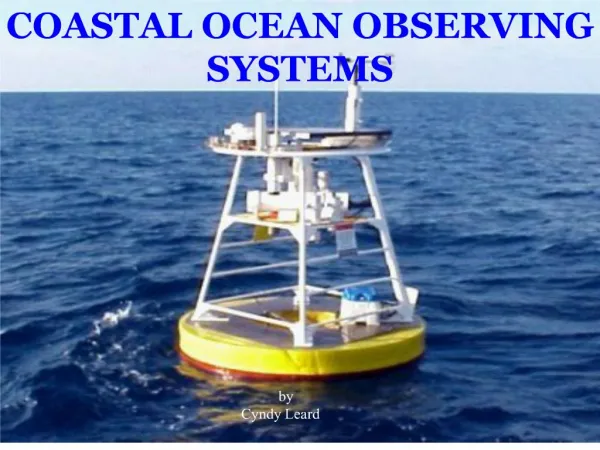
Integrating Ocean Observing Data to Enhance Protected Species Spatial Decision Support Systems Biodiversity and Ecological Forecasting Team Meeting May 17-19, 2010 Dr. Karin Forney Dr. Pat Halpin Presented by: Ben Best (Duke) Elizabeth Becker (NOAA)
Project Team Members Ben Best, Ei Fujioka, Pat Halpin, and Jason Roberts Marine Geospatial Ecology Lab Nicholas School of the Environment, Duke University Lisa Ballance, Jay Barlow, Elizabeth Becker, Steven Bograd, Karin Forney, and Jessica Redfern Southwest Fisheries Science Center NOAA - National Marine Fisheries Service Dave Foley and Daniel Palacios Joint Institute for Marine and Atmospheric Research, University of Hawai`i at Manoa Grant/Cooperative Agreement Number: NNX08AK73G
Cetaceans(whales, dolphins and porpoises) and anthropogenic threats Threats include Ship strikes Fishery bycatch Naval activities Anthropogenic sound Cetaceans protected by US laws MMPA ESA
Cetacean distributions are dynamic Balaenoptera musculus Blue whale
Marine Habitat Modeling Process Data Modeling SDSS Decision
1991 1993 1996 2001 2005 Ave. Key predictor variables Depth, Slope, SST Sample fin whale densities
Expansion and Enhancement of the SDSS El Niño La Niña Challenge: Marine mammals are highly mobile; distributions change on seasonal, interannual and decadal time scales
Expansion and Enhancement of the SDSS • Incorporate additional covariates derived from remotely-sensed data (varies by region) • Explore the implementation of Nowcast and Forecast capabilities • Update SDSS and release a package of open-source Desktop GIStools for end-users Whale, dolphin and porpoise species: Pacific: 21 species and 1 guild of beaked whales Atlantic: 12 species and five species guilds
Nowcast and Forecast Capability development GHRSST (RSS Inc.): Blended SST Developed by Remote Sensing Systems, Santa Rosa, CA • High-resolution (9 km) infrared data • Microwave (data for cloudy areas) • Optimal interpolation • Pixel-by-pixel error characterization NOWCASTS (tactical) ROMS = Regional Ocean Modeling System Developed for the NASA-funded FAST Project (Chavez, Chai, Chao, Barber and Foley) • Run by Yi Chao's group at JPL • Uses forecast surface fluxes (NCEP) • Monthly mean products with 1-9 month lead time FORECASTS (strategic)
“1991-2005 Climatology” NOWCAST – Dall’s porpoise densityfor novel 2008 survey (July-Nov) “Daily forecast”
FORECAST – Striped dolphin densityROMS: Oct/Nov 2008 (as forecast in July)
Expansion and Enhancement of the SDSS • Incorporate additional covariates derived from remotely-sensed data (varies by region) • Explore the implementation of Nowcast and Forecast capabilities • Update SDSSand release a package of open-source Desktop GIS tools for end-users Whale, dolphin and porpoise species: Pacific: 21 species and 1 guild of beaked whales Atlantic: 12 species and five species guilds
SDSS: Summarize by Region • Select Region by • Drop-down list (OPAREAs, MPAs, EEZ) • Enter polygon coordinates • Draw on map • Return: • Effort, Obs • Min, Max, Mean • Histogram • Coordinates
ROC Curve to Binary Habitat in SDSS Example: baleen guild (fin, blue, sei, Bryde’s) in summer
Example: Species distribution modeling with MGET(Marine Geospatial Ecology Tools) Invoke R from ArcGIS to create plots, etc. Sample time-series imagery Fit models with R, evaluate using ROC analysis, predict maps from satellite images Binary classification (range map) Predicted probability of presence Cutoff = 0.020 True positive rate False positive rate
Additional Derived Covariates Eddies from AVISO Fronts from Pathfinder / GHRSST Isern-Fontanet et al (2006) Cayula, J-F and P Cornillon (1992) Optimal break 27.0 °C Frequency Temperature 28.0 °C Front 25.8 °C Red: Anticyclonic Blue: Cyclonic
Hybrid Coordinate Ocean Model (HYCOM) pros: 1/12 °, cloud-free, 3D, forecast cons: modeled, since 2003, physical only
Hybrid Coordinate Ocean Model (HYCOM) cons: complicated projection
Minimal Loss Decision Mapping Loss Decision
Conclusions and Next Steps • Nowcast and forecast capabilities exceeded expectations • Incorporate additional ecological relevant covariates (e.g. ROMS-CoSiNE) • Foundation for climate-response modeling • Improved SDSS for end-user needs • Reproducibility with desktop GIS
Thank You! Funding • NASA • SERDP • NOAA Project Support • Marine mammal observers, oceanographers, chief scientists, cruise leaders, officers and crew of surveys • Yi Chao (JPL) • Fei Chai (University of Maine) • NOAA Northeast and Southeast Fisheries Science Centers • Websites • SDSS – http://seamap.env.duke.edu • MGET – http://code.env.duke.edu/projects/mget