Download
1 / 26
260 likes | 279 Vues
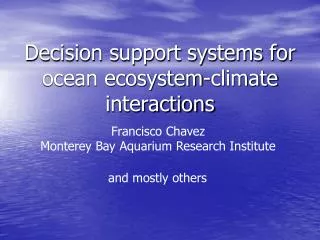
Explore integration of ocean observing data to improve protected species SDSS. Enhance models with ecological parameters for Atlantic, Pacific, and GoMex regions. Utilize open-source GIS tools and now-casting capabilities.

E N D
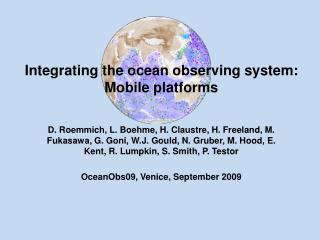
Integrating Ocean Observing Data to Enhance Protected Species Spatial Decision Support Systems Pat Halpin Nicholas School of the Environment Duke University Karin Forney Protected Species Division Southwest Fisheries Science Center NOAA NASA Biodiversity Team Meeting New York, NY May 7, 2009 (presented by Jason Roberts, Dave Foley and Elizabeth Becker)
Ben Best, Ei Fujioka, Pat Halpin, and Jason Roberts Marine Geospatial Ecology Lab Nicholas School of the Environment, Duke University Lisa Ballance, Jay Barlow, Elizabeth Becker, Steven Bograd, Karin Forney, and Jessica Redfern Southwest Fisheries Science Center NOAA - National Marine Fisheries Service Dave Foley and Daniel Palacios Joint Institute for Marine and Atmospheric Research, University of Hawai`i at Manoa Grant/Cooperative Agreement Number: NNX08AK73G Project Team Members
Spatial Decision Support System (SDSS) Provides spatially explicit, quantitative predictions of marine mammal habitat (probability of occurrence) and species density. Average summer density Predictions based on habitat variables derived from remotely sensed products. Allows environmental planners to estimate and avoid potential interactions (e.g., ship strikes, oil drilling noise, Navy exercises) with protected marine species.
Study Area: East and West Coasts, GoMex, ETP 90 mammal species 100,000 sightings
Technical Approach Marine Mammal Survey Data Habitat Data Statistical Models of Species Distribution & Density Marine Mammal Data: Ship and aerial surveys Habitat Data: Remotely sensed data Existing SDSS uses SST and chlorophyll concentration.
Spatial Decision Support System Website Drill into model type, region, species, and season
Spatial Decision Support System Website Click to turn on observation points and survey tracks
Spatial Decision Support System Website Click for details
Spatial Decision Support System Website Model summary statistics Species info (click for more) Dataset info (click for more) Scroll for statistical plots
Expansion and Enhancement of the SDSS Goal: Expand the use of earth observing information to increase the functionality and utility of this decision support system. • Incorporate a wider range of remotely-sensed earth observations into species habitat and density models • Incorporate more ecologically important parameters (e.g. frontal activity) derived from remotely-sensed data • Specific parameters will differ between regions due to differences in ecologically important oceanic processes in the Atlantic, Pacific, and Gulf of Mexico • Release important analyses and algorithms in a package of open-source desktop GIS tools, to facilitate reuse by others • Explore the implemention of now-cast and forecast capabilities in the SDSS.
Enhancements to the SDSS workflow Species observations More Earth observations Algorithms Earth observations Statistical models Ecologically important parameters Predicted distributions Summary plots SDSS website
Desktop analysis with Marine Geospatial Ecology Tools Species observations More Earth observations Algorithms Earth observations Marine Geospatial Ecology Tools (MGET) contains modular, pluggable versions of our tools in a free, open-source collection Statistical models Ecologically important parameters Predicted distributions Summary plots SDSS website
Example: Species distribution modeling with MGET Invoke R from ArcGIS to create plots, etc. Sample time-series imagery Fit models with R, evaluate using ROC analysis, predict maps from satellite images Binary classification (range map) Predicted probability of presence Cutoff = 0.020 True positive rate False positive rate
Ecologically-important parameters: fronts and eddies Image from http://www.oc.nps.edu/
Pathfinder Daytime SST 3-Jan-2005 Detecting fronts with the Cayula-Cornillon algorithm Step 1: Histogram analysis Example output Bimodal Optimal break 27.0 °C Frequency Temperature Step 2: Spatial cohesion test 28.0 °C Front • Parameters for models: • Distance to front • Frontal activity index 25.8 °C Strong cohesion front present Weak cohesion no front ~120 km
Detecting eddy cores with the Okubo-Weiss parameter SSH anomaly Example output Negative W at eddy core Aviso DT-MSLA 27-Jan-1993 Red: Anticyclonic Blue: Cyclonic Figures: Henson and Thomas (2007)
SWFSC CCE Shipboard Surveys Cetacean surveys conducted in summer/fall of 1991, 1993, 1996, 2001, & 2005. Systematic line-transect methods were used on all surveys. Completed transect lines 1991-2005
Sample Density Model Results Generalized Additive Models (GAMs) Fin whale Balaenoptera physalus Key Parameters dist. to 2,000m isobath, depth, SST, SVI, Beaufort
Improving and Refining Satellite Parameters • Derive satellite proxies to replace in situ model parameters • Sea Surface Salinity • (waiting for Aquarius) • Thermocline depth in the CCE • SSH and SST • Deep Scattering Layers (prey field) • Insolation and Attenuation coeffients • Use improved satellite and model products • Blended Satellite SST • ROMS SST fields
Moving Forward - Satellite NRT GHRSST SST fields from Remote Sensing Systems Inc. Blended SST MW/IR/OI Sep 27, 2005 Pathfinder Jun - Dec 2005 Fin whale (Balaenoptera physalus)
Moving Forward Redux • GHRSST SST near real time data from October 15, 2008 • Survey Sightings from Sep. 27 - Oct 16 Sightings Sep. 27 - Oct. 16 only
Fin Whale Hindcast with ROMS:Linkages to Other NASA Efforts ROMS output from the NASA FAST Project (Chavez, Chao, Chai and Barber) - will soon be providing forecasts with up to 9 months lead time. ROMS Oct 2005 Pathfinder Sep - Dec 2005 Fin whale (Balaenoptera physalus)
Cutting Edge: Prediction for 2008 • GHRSST SST near real time data from October 15, 2008 • Predicted Fin Whale density is quite unusual, and thus an excellent test. Blended SST Oct 15, 2008
Cutting Edge: Observed for 2008 • GHRSST SST with 2008 survey sightings • Very promising preliminary result • Perhaps get NOAA started on providing operational support Blended SST Oct 15, 2008 Sightings Oct 6 - 16 Data provided by Jay Barlow & team Fin whale (Balaenoptera physalus)
Ongoing and Future Work • East Coast team will continue to develop data products for the North Atlantic, and tools for data access and manipulation • West Coast team will develop predictor variables for the CCE, and continue to explore the use of NRT Satellite data and model output to transition these products to operational status. • The two teams will continue to coordinate and leverage the strengths of each in order to enhance the capabilities of the SDSS