Biomass Daily
Biomass Daily. A Revolution in Biomass Control. Benedikt Hálfdanarson Marketing Manager. Agenda today. Biomass Daily – Introduction Hardware and Software www.biomassdaily.com Statistics Fish B ehaviour and Research Case studies: Periodic FCR, Growth Trend

Biomass Daily
E N D
Presentation Transcript
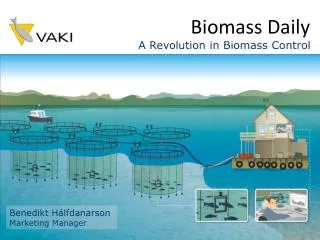
Biomass Daily A Revolution in Biomass Control Benedikt Hálfdanarson Marketing Manager
Agenda today Biomass Daily – Introduction Hardware and Software www.biomassdaily.com Statistics Fish Behaviour and Research Case studies: Periodic FCR, Growth Trend Product Development Service and Support Visit our website: www.vaki.is
Biomass Daily Hardware Visit our website: www.vaki.is
What is Biomass Daily? Frame installed in every cage. Wireless transmission of data from cage to PC on the barge. Automatic calculation of size and condition factor. Continuous measurements, 24 hours, seven days a week. All data accessible on the internet at all times. Automatic reporting via e-mail.
Benefits of using Biomass Daily Larger samples, higher accuracy. Daily information on average weight and size distribution. Average condition factor and distribution. Live data from all cages accessible on the internet. Installed once, more time for other things. Simple but powerful analysis of the data. No stress to the fish, no disturbance to the feeding.
The use of the Data Reporting accurate weight and size distribution to harvest. Lower overall FCR with focus on periodic FCR. Monitoring growth, comparing to environmental factors. Controlling production wrt. Maximum Biomass Allowance. Correcting growth models with data on real growth. Decisions on grading or splitting. Correct insurance value and for internal reporting.
A known Picture – Wide Spread Arnfinn Aunsmo at Salmar has compared reported and actual numbers and average weight from harvest for three companies in Mid-Norway (without Biomass Daily). The error on average weight is more than +/- 5% in 30% of the cases.
Dashboard overview with Biomass Daily Full overview on status in all cages with average weight and number of fish. Shows when the last fish was measured. White: OK. Yellow: to few fish. Red: No contact.
Grafic Overview with Biomass Daily Grafic overview on all cages on one screen. Shows the number of measured fish and the growth trend for a chosen period. 7,14,30,60,90 days.
Daily Growth and Condition Factor Daily average weight gives a growth trend based on measurements of thousands of fish. Trend curve with daily measurements gives much more reliable data than single measurements. Unusual changes in the growth trend can be spotted more easily. It is possible to monitor the trend in the condition factor.
Growth Trend, Calculations of SGR & bFCR Specific Growth Rate (SGR) can be calculated for a chosen period. bFCR is calculated for a chosen period. If daily number of fish is larger than 200 the color of the averaged weight is blue and the cf line is green. If fewer than 200 fish a day, the points are gray.
Comprehensive Report Report with size distribution, both graphic and in table. Average weight and total biomass. If the number of fish in the cage is known then the total biomass is calculated for each size group. Average condition factor. All parameters are shown in the report. Max/min CF and weight kan be used to exclude unwanted fish. The data can be exported in different formats: pdf, excel, word, Tiff, HTML, etc.
Report with Gutted Weight The report also shows the gutted weight with a chosen gutting factor
Automatic Reporting Full report with overview on growth the last 30/90 days, along with all key data is e-mailed automatically every month. In addition every single mesurement for the last week is shown, for monitoring daily swimming patterns. Comparison of growth in all cages Easy to compare data to production program.
Put Focus on the Increased Value The value in a cage with 50,000 5kg fish is 1.245 mill US$ 17% gutting factor and 6 US$/kg 0,2% daily growth for 30 days > increased value 76,900 $ 0,3% daily growth for 30 days > increased value 117,000 $ 0,4% daily growth for 30 days > increased value 158,400 $ Feed or other costs not included Biomass Daily gives accurate data on actual growth
Sampling and Statistics Size of the sample matters, the bigger the better. The sample also needs to represent all the fish i the cage.
Sample Size A sample of 100 fish gives +/- 6% of error.
Larger Frame and Sonar A new larger frame for bigger samples. Up to ten times larger samples with the large frame. Sonar for monitoring the fish behaviour. Depth sensor to register accurate position. Winches used to control the position of the frame.
Effect of Larger Frame The opening of the large frame is double to the standard one.
Using Sonar to Find the Best Spot Frame lowered to 11 meters depth October 2nd.
Number of Fish through the Frame per hour Frame lowered just before 11 AM. Salmon started swimming through the frame two hours later.
Factors that Effect Projected Growth Wrong number of fish in the cage (delivery, mortality, splitting...) Environmental factors (temperature, oxygen level, salinity, weather...) Health related issues Handling and treatment Uncalibrated feeding system Human elements (motivation, subjective interpretation .....)
Cage 7 In all seven cages, book weights were running higher than Biomass Daily. Actual harvest yield was less than expected acording to book.
Cage 7 Strong tides in July and August resulted in high actual FCR.