Download
1 / 32
320 likes | 416 Vues
Learn how ICT is essential for reducing greenhouse gas emissions, the interdependence of the internet and climate change, and global efforts towards emission reduction targets.

E N D
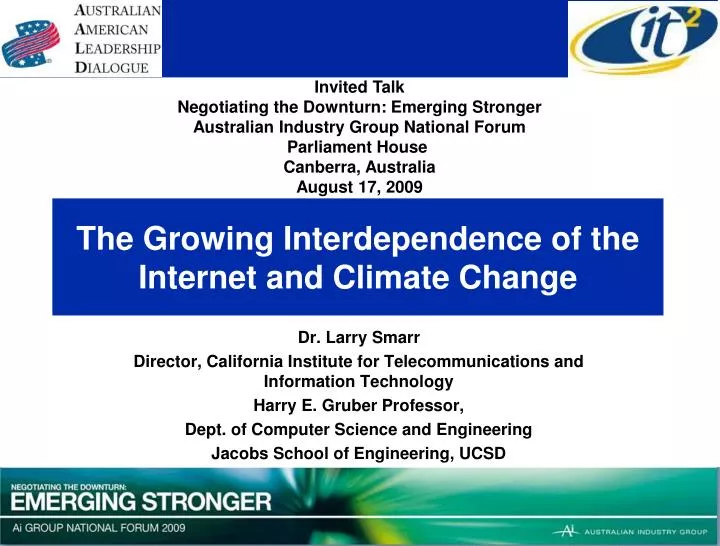
Invited Talk Negotiating the Downturn: Emerging Stronger Australian Industry Group National Forum Parliament House Canberra, Australia August 17, 2009 The Growing Interdependence of the Internet and Climate Change Dr. Larry Smarr Director, California Institute for Telecommunications and Information Technology Harry E. Gruber Professor, Dept. of Computer Science and Engineering Jacobs School of Engineering, UCSD
Australia’s National Broadband Network (NBN) Can Be Leveraged to Speed Climate Goals • NBN Goals • Connect 90% of Households with Fiber in Eight Years • Remaining 10% by Satellite or Wireless • 100 Mbit/s Broadband Per House • Driven by Consumer Internet, Telephone, Video • “Triple Play”, eHealth, eCommerce… • “Smart” Electric Grid • Reduce Household and Building Energy Usage • Avoid Peak Loading • Video Conferencing to Avoid Transportation • Plug-In Hybrid with Renewable Electricity Generation • Cloud Computing and Storage at Renewable Sites
ICT is a Critical Element in Achieving Countries Greenhouse Gas Emission Reduction Targets • GeSI member companies: • Bell Canada, • British Telecomm., • Plc, • Cisco Systems, • Deutsche Telekom AG, • Ericsson, • France Telecom, • Hewlett-Packard, • Intel, • Microsoft, • Nokia, • Nokia Siemens Networks, • Sun Microsystems, • T-Mobile, • Telefónica S.A., • Telenor, • Verizon, • Vodafone Plc. • Additional support: • Dell, LG. www.smart2020.org
The Earth is Warming Over 100 Times Faster TodayThan During the Last Ice Age Warming! http://scrippsco2.ucsd.edu/program_history/keeling_curve_lessons.html Monnin, et al., Science v. 291 pp. 112-114, Jan. 5, 2001. CO2 Has Risen From 335 to 385ppm (50ppm) in 30 years or 1.6 ppm per Year CO2 Rose From 185 to 265ppm (80ppm) in 6000 years or 1.33 ppm per Century
Global Climate Disruption Early Signs:Arctic Summer Ice is Rapidly Decreasing “The Arctic Ocean will be effectively ice free sometime between 2020 and 2040, although it is possible it could happen as early as 2013.” --Walt Meier, Research Scientist at the National Snow and Ice Data Centre at the University of Colorado http://news.cnet.com/8301-11128_3-10213891-54.html
CO2 Emissions From Energy-Shell ”Blueprint” Scenario: An Aggressive CO2 Emission Reduction Scenario www-static.shell.com/static/public/downloads/brochures/corporate_pkg/scenarios/shell_energy_scenarios_2050.pdf China and India resisted signing up for a global goal of halving greenhouse gas emissions by 2050.—Reuters July 8, 2009 China India
In Shell’s “Blueprints” Scenario, 60% of Electricity is Generated by Renewables by 2050 90% of All OECD Coal and Gas Power Plants Use Carbon Capture and Sequestration
Ice Core Record Has Been Extended Using Plankton:Today’s CO2 is Higher Than in Last 2 Million Years! With No Policy Change, MIT Estimates ~900ppm by 2100 Possible Level by 2100, Shell “Blueprints” Scenario 550 500 450 400 Today’s CO2 Level 350 Hönisch, et al. Science 19 June 2009 Vol. 324. pp. 1551 - 1554
We are Unlikely to Limit CO2-Equivalent Emissions Below 450ppm Limiting GHG concentrations to 450 ppm CO2-equivalent is expected to limit temperature rises to no more than 2°C above pre-industrial levels. This would be extremely challenging to achieve, requiring an explosive pace of industrial transformation going beyond even the aggressive developments outlined in the Blueprints scenario. It would require global GHG emissions to peak before 2015, a zero-emission power sector by 2050 and a near zero-emission transport sector in the same time period…
We Are Transitioning to a New Climate State --Unlike the Rapid Recovery with Acid Rain or Ozone Hole Susan Solomon, et al., PNAS 2/10/2009 v. 106 pp1704-9 Assumes CO2 Increases to a Maximum and Then Emissions Abruptly Stop Warming Persists for Over 1000 Years Warming During the Industrial Age --Last 200 Years
“It Will Be the Biggest Single Peacetime Project Humankind Will Have Ever Undertaken”
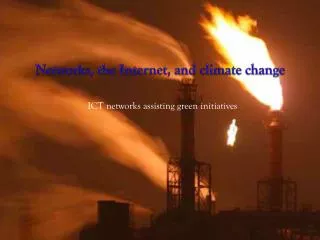
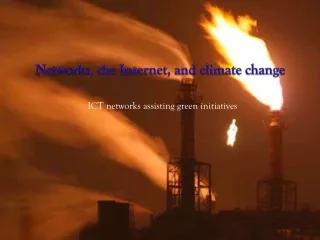
The Global ICT Carbon Footprint isRoughly the Same as the Aviation Industry Today But ICT Emissions are Growing at 6% Annually! Most of Growth is in Developing Countries • the assumptions behind the growth in emissions expected in 2020: • takes into account likely efficient technology developments that affect the power consumption of products and services • and their expected penetration in the market in 2020 www.smart2020.org
Reduction of ICT Emissions is a Global Challenge –U.S. and Canada are Small Sources U.S. and Canada Together Fall From 25% to 14% of Global ICT Emissions by 2020 www.smart2020.org
New Techniques for Dynamic Power and Thermal Management to Reduce Energy Requirements • NSF Project Greenlight • Green Cyberinfrastructure in Energy-Efficient Modular Facilities • Closed-Loop Power &Thermal Management • Dynamic Power Management (DPM) • Optimal DPM for a Class of Workloads • Machine Learning to Adapt • Select Among Specialized Policies • Use Sensors and Performance Counters to Monitor • Multitasking/Within Task Adaptation of Voltage and Frequency • Measured Energy Savings of Up to 70% per Device • Dynamic Thermal Management (DTM) • Workload Scheduling: • Machine learning for Dynamic Adaptation to get Best Temporal and Spatial Profiles with Closed-Loop Sensing • Proactive Thermal Management • Reduces Thermal Hot Spots by Average 60% with No Performance Overhead System Energy Efficiency Lab (seelab.ucsd.edu) Prof. Tajana Šimunić Rosing, CSE, UCSD
UCSD is Installing Zero Carbon EmissionSolar and Fuel Cell DC Electricity Generators UCSD 2.8 Megawatt Fuel Cell Power Plant Uses Methane Available Late 2009 San Diego’s Point Loma Wastewater Treatment Plant Produces Waste Methane Use to Power Local Data Centers 2 Megawatts of Solar Power Cells Being Installed
Australia—the Zero Carbon Energy Future Placing a data centre at the zero carbon energy source -- the cost of fibre optic cable is ~5-10% the cost of electricity transmission. A Fiber/HVDC Smart Grid Flows Both Bits and Electrons! Temperatures at 5 km. After Budd et al. Australian Geothermal Energy Conference 2008 Source: Geodynamics, Limited
Coupling AARNet - CENIC/PW - CANARIE Optical Nets:An Australian-U.S.-Canada Green Cloud Testbed Toward Zero Carbon ICT
Application of ICT Can Lead to a 5-Fold GreaterDecrease in GHGs Than its Own Carbon Footprint While the sector plans to significantly step up the energy efficiency of its products and services, ICT’s largest influence will be by enabling energy efficiencies in other sectors, an opportunity that could deliver carbon savings five times larger than the total emissions from the entire ICT sector in 2020. --Smart 2020 Report Major Opportunities for the United States* • Smart Electrical Grids • Smart Transportation Systems • Smart Buildings • Virtual Meetings * Smart 2020 United States Report Addendum www.smart2020.org
Applying ICT – The Smart 2020 Opportunityfor Reducing GHG Emissions by 7.8 GtCO2e www.smart2020.org Smart Buildings Smart Electrical Grid Recall Total ICT 2020 Emissions are 1.43 GtCO2e
Next Stage: Developing Greener Smart Campuses Calit2 (UCSD & UCI) Prototypes • Coupling the Internet and the Electrical Grid • Choosing non-GHG Emitting Electricity Sources • Measuring Demand at Sub-Building Levels • Reducing Local Energy Usage via User Access Thru Web • Transportation System • Campus Wireless GPS Low Carbon Fleet • Green Software Automobile Innovations • Driver Level Cell Phone Traffic Awareness • Travel Substitution • Commercial Teleconferencing • Next Generation Global Telepresence
I Link Into Commercial H.323 Videoconfernces From My Laptop at Home UCSD Calit2 Director & Chief of Staff UCI Calit2 Director The Weekly Calit2 Director’s Meeting
Work at Home is the Same As at the Office Virtual Kristen Kristen Prints Here For Amy Real Amy Kristen Reads My Email, Sets My Calendar. Works With Amy on My Trips We Run Video Sykpe Continuously During Office Hours
It Doesn’t Matter Where in the Broadband World The Other Person Lives David Abramson, Monash University, and Me Discussing My Upcoming Trip to Melbourne
HD Talk to Australia’s Monash University from Calit2:Reducing International Travel July 31, 2008 Qvidium Compressed HD ~140 mbps Source: David Abramson, Monash Univ
Launch of the 100 Megapixel OzIPortal Kicked Off a Rapid Build Out of Australian OptIPortals Smarr OptIPortal Road Show January 15, 2008 January 15, 2008 No Calit2 Person Physically Flew to Australia to Bring This Up! Covise, Phil Weber, Jurgen Schulze, Calit2 CGLX, Kai-Uwe Doerr , Calit2 http://www.calit2.net/newsroom/release.php?id=1421
Victoria Premier and Australian Deputy Prime Minister Asking Questions www.calit2.net/newsroom/release.php?id=1219
University of Melbourne Vice Chancellor Glyn Davis in Calit2 Replies to Question from Australia
Real-Time Monitoring of Building Energy Usage:UCSD Has 34 Buildings On-Line http://mscada01.ucsd.edu/ion/
Power Management in Mixed Use Buildings:The UCSD CSE Building is Energy Instrumented Source: Rajesh Gupta, CSE, Calit2 • 500 Occupants, 750 Computers • Detailed Instrumentation to Measure Macro and Micro-Scale Power Use • 39 Sensor Pods, 156 Radios, 70 Circuits • Subsystems: Air Conditioning & Lighting
Launch of ZEVnet Fleet of Wireless Cars-- First Calit2 Testbed for Intelligent Transportation April 18, 2002 Irvine, CA www.zevnet.org
International Symposia on Green ICT:Greening ICT and Applying ICT to Green Infrastructures Webcasts Available at: www.calit2.net/newsroom/article.php?id=1456 Calit2@UCSD