Download
1 / 30
300 likes | 440 Vues
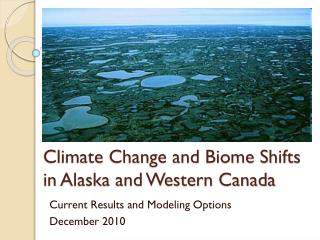
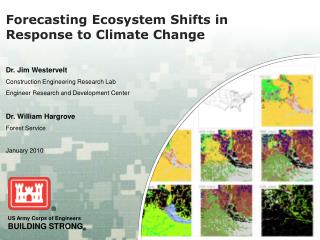
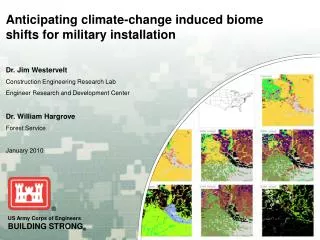
Dr. Jim Westervelt Construction Engineering Research Lab Engineer Research and Development Center Dr. William Hargrove Forest Service January 2010. Anticipating climate-change induced biome shifts for military installation. Overall Challenge. Military installation ecosystems support

E N D
Dr. Jim Westervelt Construction Engineering Research Lab Engineer Research and Development Center Dr. William Hargrove Forest Service January 2010 Anticipating climate-change induced biome shifts for military installation
Overall Challenge • Military installation ecosystems support • Military training and testing • Populations of important plant/animal species • Examples of relatively pristine habitat • Potential consequence of ecosystem shifts • Training/testing type, time, capacity • Loss/gain of habitat • Changes to installation natural resource management plans
Question Ideal: How and when will ecosystems shift in response to climate change? Two parts: Where can I currently find ecosystem driver conditions that match forecasted driver conditions? How and when will current ecosystems shift in response? ✔
Approach Covered by Bill Hargrove’s talk • Identify a set of ecosystem drivers • Develop global maps of those drivers • For current and future conditions • Conduct a cluster analysis • To group related areas Covered in this talk • Correlate clusters with current ecosystems • Forecast future ecosystem conditions
Ecosystem drivers 1. Precipitation during the locally hottest quarter 2. Precipitation during the locally coldest quarter 3. Precipitation during the locally driest quarter 4. Precipitation during the locally wettest quarter 5. Ratio of precipitation to potential evapotranspiration 6. Temperature during the coldest locally quarter 7. Temperature during the hottest locally quarter 8. Sum of monthly Temp avg where Temp avg >= 5 deg C 9. Integer number of consecutive months where Temp avg >= 5 deg C 10. Available water holding capacity of soil 11. Bulk density of soil 12. Carbon content of soil 13. Nitrogen content of soil 14. Compound topographic index (relative wetness) 15. Solar interception 16. Day/night diurnal temperature difference CC-Based Collected by Chris Zganjar at TNC from WORLDCLIM (http://www.worldclim.org) Constant
Develop global maps of drivers • Choose general circulation models (GCM) • Hadley and PCM (high and low) • Choose climate scenarios • A1 (higher CO2) and B1(lower CO2) • Choose time • Current, 2050, 2100 (based on 30-yr averages) • Collect maps (for current and 8 futures)
Scenarios • A1 scenarios characterized by: • Rapid economic growth. • A global population that reaches 9 billion in 2050 and then gradually declines. • The quick spread of new and efficient technologies. • A convergent world. • B1 scenarios are characterized by: • Rapid economic growth as in A1 • Rapid changes towards a service and information economy. • Population as in A1. • Reductions in material intensity and the introduction of clean and resource efficient technologies. • An emphasis on global solutions to economic, social and environmental stability.
Cluster Analysis • Convert all maps to standard-deviation form • Run cluster analysis (30,000 clusters) Grouping all sets across the 9 worlds!! Hargrove and Hoffman
Results • Correlation with GAP and TNC • Application of correlation to future • Sample look at Illinois • Results for all military installations
Correlate Clusters with Ecosystems • Choose ecosystem map • GAP • US • 533 types • TNC • Global • 814 types
PCM model – B1 scenario (low-low) 2000 TNC GAP 2050 2100
Hadley model – A1 scenario (high-high) 2000 TNC GAP 2050 2100
Illinois GAP – Current Forest Cultivated Cropland Pasture/Hay Forest Managed Southern Tall Grassland
Illinois GAP – PCM A1 2050 Cultivated Cropland Pasture/Hay Managed Southern Tall Grassland
Illinois GAP – PCM A1 2100 Cultivated Cropland No Analog No Analog Pasture/Hay Managed Southern Tall Grassland No Analog No Analog Managed Southern Tall Grassland
Illinois TNC – Current Central Tallgrass Prairie North Central Tillplain Interior Low Plateau Ozarks Crosstimbers and Southern Tallgrass Prairie
Illinois TNC – PCM A1 2050 North Central Tillplain Central Tallgrass Prairie Interior Low Plateau Ozarks Crosstimbers and Southern Tallgrass Prairie
Illinois TNC – PCM A1 2100 No Analog No Analog Central Tallgrass Prairie North Central Tillplain Ozarks No Analog Interior Low Plateau No Analog No Analog Crosstimbers and Southern Tallgrass Prairie
Results for Military Installations • All Navy, Marines, Air Force, and Army • Two Models • Hadley and PCM • Two Scenarios • A1 and B1 • Three times • 2000, 2050, and 2080
Discussion • We have a process for turning GCM/RCM forecasts into potential future ecosystem maps. • We applied the process to the last round of forecasts • Ready to apply to the next round • Massive ecosystem shifts?
Next? Two parts: • Forecasted conditions currently support what ecosystems? ✔ • How and when will current ecosystems shift in response? • Resilience • Persistence • Seed distribution rates • ??
Cedar Infestation, Nebraska Fire Ants and Cave Crickets, Ft Hood Some Ecological Sim Models • Quick • Spatial • Agent-based Striped Newt, Ft. Stewart Feral Hogs, Fort Benning Gopher Tortoise, Ft. Benning
Questions?? • Sample Forest Service forecasts of movement of optimal tree habitat: • http://www.geobabble.org/~hnw/global/treeranges2/climate_change/index.html • ERDC-CERL forecasts of ecosystem shifts around military installations: • http://earth.cecer.army.mil