Download
1 / 19
190 likes | 288 Vues
This study focuses on designing science flights to study the transport of trace gases in convection using ATTREX 2013 as a trial run. Analyze tracer measurements, joint flight plans, data representation, and more. Ongoing analysis includes density distribution, tracer analysis, and resolution feasibility.

E N D
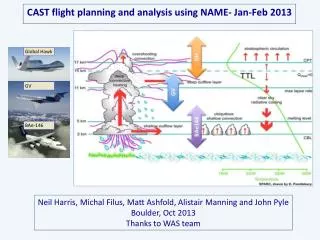
Global Hawk GV CAST flight planning and analysis using NAME- Jan-Feb 2013 BAe-146 Neil Harris, Michal Filus, Matt Ashfold, Alistair Manning and John Pyle Boulder, Oct 2013 Thanks to WAS team
Goals Designing science flights whose measurements can be jointly used to studythe transport of trace gases in convection (inflow and outflow). Use ATTREX 2013 as a trial run. Analyse tracer measurements from ATTREX 2013, esp. WAS. Joint flight plans - Jan-Feb 2014
Linking GH and 146 • Data representation: • Distribution studies: fractions crossed 5km • Air history maps • *Altitude vs time plots: qualitative assessment of air mass convection • *Meteorological maps showing weather conditions Density of particles below 5 km. 12 day back trajectories run using forecast and analysis data. Back-traj started in solid boxes 12% 10% 51% 15%
Linking GH and 146 Met Office forecasts and analyses NAME traj dispersion 12 days back Start at 14-16 km in East Pacific Run daily Fraction of air at 14-16 km coming from BL 25 Jan – 29 Mar 2013 Variation over time Consistency between forecasts
GH East Pacific NAME runs: altitude changes 25 SW box above 16 km 60 SW box 14-16 km
WAS CHBr3 - 2013 16 > z > 14 km Mean of easterly values Z > 16 km Mean of easterly values
WAS CHBr3 - 2013 Excess caused by recent convection? 16 > z > 14 km Mean of easterly values LZRH mean (WMO, 2011) Upper TTL mean (WMO, 2011) Z > 16 km Mean of easterly values Upper TTL mean (WMO, 2011) Tropical tropop (WMO, 2011)
Ongoing analysis of WAS CHBr3 - 2013 • Simple model: • Two sources of air: TTL and inflow region • Depends on • Time since boundary layer • Fraction from in boundary layer • Can make more complicated assumptions about trajectories which did not enter low troposphere (in-mixing) [T]MBL [T]TTL 0% 100% Fraction of air from MBL [T]MBL = ~2 ppt for CHBr3 [T]TTL = 0.2 ppt for CHBr3
Ongoing analysis of WAS CHBr3 - 2013 • Tracer analysis: Density distribution over the boxes • Calculate concentrations of tracers based on WMO climatology and fixed half-life • Compare modelled results with ATTREX measurements • What resolution is feasible? Back trajectories from Feb 26 2013which cross 5 km (left) & 1 km (right)
Variability – select dates, areas Met Office forecasts and analyses NAME traj dispersion 12 days back Start at 14-16 km in East Pacific Run daily Fraction of air at 14-16 km coming from BL 25 Jan – 29 Mar 2013 Variation over time Consistency between forecasts
Forward calculations from West Pacific below 5 km Met Office forecasts NAME traj dispersion +5 days ahead Start in region of 146 Run daily Anticyclone clear Much in range of GV Based on Ashfold et al., 2012 > 13 km > 10 km
Forward calculations from West Pacific below 5 km Met Office forecasts NAME traj dispersion +5 days ahead Start in region of 146 Run daily Variation over time Fraction of air in BL reaching 10 km 1 Jan – 31 Mar 2013 0.3 0
Forward calculations from West Pacific below 5 km Consider 4 regions
Forward calculations from West Pacific below 5 km Variability in all Within 5 days of forecasts, most which have got up there are still within 20°
Forward calculations from West Pacific below 5 km 0.02 16 km Less transport to higher altitudes More geographic spread if it gets there Implication for flight planning: also need 12 day back-trajectories 0.14 13 km 0.30 10 km
Surface and sonde measurements Certainly use trajectories – others? Thank you