Download
1 / 17
270 likes | 680 Vues
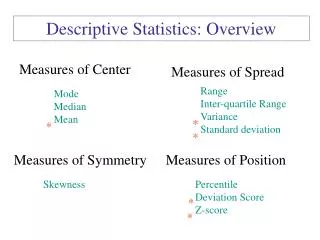
Descriptive Statistics-IV (Measures of Variation). QSCI 381 – Lecture 6 (Larson and Farber, Sect 2.4). Deviation, Variance and Standard Deviation-I. Deviation. The of a data entry x i in a population data set is the difference between x i and population mean , i.e.

E N D
Descriptive Statistics-IV(Measures of Variation) QSCI 381 – Lecture 6 (Larson and Farber, Sect 2.4)
Deviation, Variance and Standard Deviation-I Deviation • The of a data entry xi in a population data set is the difference between xi and population mean , i.e. • The sum of the deviations over all entries is zero. • The is the sum of the squared deviations over all entries: • is the Greek letter sigma. Population variance
Deviation, Variance and Standard Deviation-II Population standard deviation • The is the square root of the population variance, i.e.: • Note: these quantities relate to the population and not a sample from the population. • Note: sometimes the standard deviation is referred to as the standard error.
The Sample variance and Standard Deviation • The and the of a data set with n entries are given by: Sample variance Sample standard deviation Note the division by n -1 rather than N or n.
Example • Find the standard deviation of the following bowhead lengths (in m): (8.5, 8.4, 13.8, 9.3, 9.7) • Key question (before doing anything) – is this a sample or a population?
Formulae in EXCEL • Calculating Means: Average(“A1:A10”) • Calculating Standard deviations: Stdev(“A1:A10”) – this calculates the sample and not the population standard deviation!
Standard Deviations-I SD=0 SD=2.1 SD=5.3
Standard Deviations-II(Symmetric Bell-shaped distributions) k = 2: proportion > 75% k = 3: proportion > 88% Chebychev’s Theorem: The proportion of the data lying within k standard deviations (k >1) of the mean is at least 1 - 1/k2 68% 34% 95% 13.5% 99.7%
Standard Deviations-III(Grouped data) • The standard deviation of a frequency distribution is: • Note: where the frequency distribution consists of bins that are ranges, xi should be the midpoint of bin i (be careful of the first and last bins).
The Coefficient of Variation • The is the standard deviation divided by the mean - often expressed as a percentage. • The coefficient of variation is dimensionless and can be used to compare among data sets based on different units. coefficient of variation
Z-Scores Standard (or Z) score • The is calculated using the equation:
Outliers-I • Outliers can lead to mis-interpretation of results. They can arise because of data errors (typing measurements in cm rather than in m) or because of unusual events. • There are several rules for identifying outliers: • Outliers: < Q2-6(Q2-Q1); > Q2+6(Q3-Q2) • Strays: < Q2-3(Q2-Q1); > Q2+3(Q3-Q2)
Outliers-II • Strays and outliers should be indicated on box and whisker plots: • Consider the data set of bowhead lengths, except that a length of 1 is added! 5 10 15 Length (m)
Summary • We use descriptive statistics to “get a feel for the data” (also called “exploratory data analysis”). In general, we are using statistics from the sample to learn something about the population.