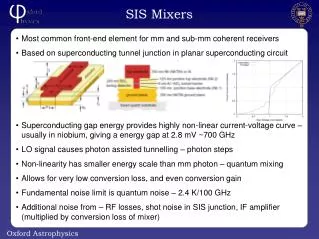
SIS-100 simulation
SIS-100 simulation. Partha Pratim Bhaduri Subhasis Chattopadhyay VECC, Kolkata. p-A simulation for J/ y at SIS-100 Much geometry optimization for SIS-100. p-A simulation. Motivation.

SIS-100 simulation
E N D
Presentation Transcript
SIS-100 simulation Partha Pratim Bhaduri Subhasis Chattopadhyay VECC, Kolkata
p-A simulation for J/y at SIS-100 Much geometry optimization for SIS-100
Motivation • The aim of the relativistic heavy-ion collisions is to study the onset of de-confinement and the properties of the de-confined media in the laboratory. Hence it is necessary to define unambiguous and experimentally viable probes for de-confinement. • In this respect proton-nucleus (p+A) collisions must be a fundamental component of any heavy-ion physics program • Defines the reference baseline relative to which we recognize HI specific phenomena • p+A collisions provide a measure of the nuclear effects – helps in disentangling the “QGP” effect from the “non-QGP” effects. Here there is no formation time for the “secondary” medium , hence such collisions provide as essential tool to correctly account for the effect of the nuclear medium initially present. 4
System • The specifications of the system chosen are: • Target : Au, Cu, S, O, C • Projectile : p (1, 1) • Beam energy : 30 GeV • Event generator used : HSD – 2.5 • Events : 5,000 (ISUBS = 50, NUM = 100) 5
J/y pseudo-rapidity distribution pC pO pS pCu pAu pC pO pS pCu pAu CMS Frame Laboratory Frame Results with HSD 6
pC pO pS pCu pAu J/y transverse momentum spectra 7
HSD Pluto HSD vs. Pluto (muon pseudo-rapidity distribution) 8
Laboratory Frame CMS Frame Muons decayed from J/y Isotropic decay in J/y rest frame Laboratory Frame 9
CbmRoot Version: Trunk version Number of events : 4000 Much geometry : Standard Geometry • 2 layers in 5 stations • Distance between layers 10 cm. • Gap between absorbers 20 cm • 3 layers at the last trigger station • Total 13 layers • Total length of Much 350 cm Signal : J/ decayed muons from HSD for p+Au system for 30 GeV p beam Background : central UrQMD events for p+ Au at 30 GeV/n Much Hit producer w/o cluster & avalanche L1(STS) & Lit (Much) tracking with branching Absorber thickness (cm): 20 20 20 30 35 100 Simulation 10
Analysis • Use the reconstructed data after the full tracking through the detector set-up. • Reconstructed global tracks have to satisfy : • Fraction of true hits (truehits/(true hits+ wrong hits+fake hits) >= 0.7 • No. of STS Hits associated with the global track >=4 • No. of Much Hits associated with the global track >=10 • Chi2 primary <=2 11
Raw HSD Layer # 1 Layer # 3 Layer # 5 Layer # 7 Layer # 9 Layer # 11 Detector Acceptance 12
Negligible background effect Invariant mass spectra Pure HSD Reconstruction efficiency : 25 % Embedded Reconstruction efficiency : 23.8 % 13
Our aim is to optimize the geometry of the muon set-up for SIS-100. • Optimization should be done with low mass vector mesons (lmvms) rather than J/ψ and at the lowest available energy. • J/ψ measurements due to low background after more than 2 m of Fe are not so sensitive to the muon setup as the measurements of muons from LMVM. • Issue is to reconstruct the soft muons ( eg: ω→μμ ) • We have chosen central Au+Au events at 8 AGeV together with ω→μμ. • Use the same set-up in simulation for J/ψ & LMVM. For LMVM use information from stations just before the last thick absorber. • Run full simulation & obtain signal reconstruction efficiency & S/B ratio. • Statistics : 10k central events 15
We have to decide upon : • Total number of stations(layers) • Total absorber thickness, total no. of absorbers & the absorber material • Number of stations (2/3) in between two absorbers • Distance between stations & absorber to station distance • Present constraints in simulation : • Absorber material (Fe, Pb, W ) • Layer to layer distance >= 10 cm. • Absorber to layer distance >= 5cm.
Absorber thickness (cm): 20 20 20 30 35100 • Cuts : • No. of Much hits>=9 • 70 % true hit • No. of STS Hits >=4 Number of stations : 13(2+2+2+2+2+3) Absorber to station distance : 5 cm. Layer to layer distance : 10 cm. Super event (SE) analysis for bkg. Gaussian fit to signal Polynomial fit to bkg. • Cuts : • No. of Much hits>=9 • 70 % true hit • No. of STS Hits >=4 Reconstruction efficiency : 0.5 % Estimated Signal : 645.234 Estimated Bkg. : 573.028 S/B : 1.126
Option II : Reduced geometry • Cuts : • No. of Muchhits>=7 • 70 % true hit • No. of STS Hits >=4 Number of stations : 11(2+2+2+2+3) Absorber to station distance : 5 cm. Layer to layer distance : 15 cm. Super event (SE) analysis for bkg. Gaussian fit to signal Polynomial fit to bkg. Absorber thickness (cm): 20 20 30 35100 Reconstruction efficiency : 1.6 % Estimated Signal : 3997.52 Estimated Bkg. : 30052.1 S/B : 0.133 GEM Modules : 25.6 cm. * 25.6 cm. # of modules : 1928
Option III : Reduced Geometry • Cuts : • No. of Muchhits>=7 • 70 % true hit • No. of STS Hits >=4 Number of stations : 9 (3+3+3) Absorber to station distance : 10 cm. Layer to layer distance : 10 cm. Super event (SE) analysis for bkg. Gaussian fit to signal Polynomial fit to bkg. Absorber thickness (cm): 30 70 125 Reconstruction efficiency : 1.4 % Estimated Signal : 2874.44 Estimated Bkg. : 9936 S/B : 0.2866 GEM Module : 25.6cm.*25.6 cm. # of Modules : 1512
To do list ….. • Continue the study with 9 station configuration but with same total absorber thickness (125 cm.) • Test the configuration for charmonia • Study of gaps ( station to station & station to absorber)