Download
1 / 110
1.12k likes | 1.42k Vues
How to use this Self-guided Tour. This self-guided tour is designed for you to work through at your own pace. It also allows you to review or skip a section. The following Features are included to help you navigate through this exercise:.

E N D
How to use thisSelf-guided Tour • This self-guided tour is designed for you to work through at your own pace. It also allows you to review or skip a section. • The following Features are included to help you navigate through this exercise: At any point throughout the tour, you may jump to the beginning of either one of the six Sectionsbelow. Underlined wordstake you directly to the respective subject. The Arrow Buttons allow you to move forward or backwards in the exercise.
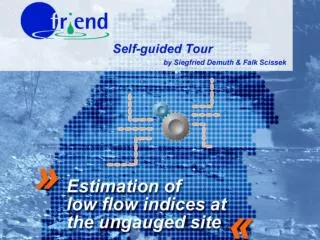
AimBackground and Objectives • The low-flow regime of a river controls industrial, agricultural and domestic water resources. In this context, low flows are critical for maintaining surface-water abstraction, dilution of effluents, and hydropower and for providing an adequate freshwater habitat for a wide range of flora and fauna. • For an integrated catchment management it is necessary to have access to low-flow indices not only at the gauged site but also at the ungauged site. In the case of the ungauged site it is necessary to estimate low-flow indices with appropriate methods (BECKER 1992). • A widely-used method for this purpose applies multiple regression analysis to estimate low-flow indices at the ungauged site, taking catchment descriptors as independent variables. • This self-guided tour demonstrates a practical procedure to estimate low-flow indices at the ungauged site through the learning-by-screening method. • You will learn: • to develop a conceptual model, • to translate the conceptual model into a mathematical model, • to calibrate the necessary mathematical transfer function by means of linear multiple regression analysis between catchment descriptors and low-flow indices, • to evaluate the model based on prior assumptions and the goodness of the fit, • to validate the model with the help of a separate data set, and • to apply the model to a real case. Aim
AimProblem Statement (1) • The map on the right shows the State of Baden-Württemberg in Southwest Germany. • You will be introduced to the study area in the next section. • Let us consider the following problem statement: Supposedly, a hydro-power station is planned to be built at the outlet of the Wiese catchment ( ). For design purposes we are asked to characterise the low-flow behaviour of the Wiese by determining the Q90 value. Unfortunately, there are no runoff data available for this catchment. • Is there a way we could still • give an estimate of the Q90? Karlsruhe Strasbourg (France) Stuttgart Freiburg Basel (Switzerland) N 100 km Fig. 1.1 Map of the study area Aim
AimProblem Statement (2) • Even though runoff data are unavailable, we do have access to information on the catchment itself. While some of this information can be deduced from maps (e.g. catchment area and mean elevation) while other information must be acquired in the field (e.g. precipitation). • Click here to learn more about the available information on this catchment • From historical research we can be quite certain that runoff processes are related to a certain set of catchment attributes, which we will call catchment descriptors. However, we do not know how they are related. Q90 = ? Wiese Site of the proposed hydro-power plant How can we gain information on the expected relationship between the Q90 and the catchment descriptors? Fig. 1.2 Wiese catchment (No. 532) Aim
AimAvailable Catchment Descriptors Soil Percentage of soils with high infiltration capacity 0.19% Percentage of soils with medium infiltration capacity 0% Percentage of soils with low infiltration capacity 99.81% Percentage of soils with very low infiltration capacity 0% Mean hydraulic conductivity of the soils 201.69 cm/d Percentage of soils with low hydraulic conductivity 0% Percentage of soils with high water-holding capacity in the effective root zone 0% Mean water-holding capacity in the effective root zone 109 mm Q90 = ? Morphometry Catchment area 206.28 km2 Drainage density 1.31 km/ km2 Highest elevation 1485.5 m a.m.s.l. Lowest elevation 423.6 m a.m.s.l. Average elevation 898.74 m a.m.s.l. Maximum slope 45.54% Minimal slope 0 % Average slope 18.08% Climate Annual precipitation 1891 mm Land Use Percentage of urbanisation 2% Percentage of forested area 63% Hydrogeology Percentage of rock formations with a very low hydraulic permeability 0% Weighted mean of hydraulic conductivity 9.62 * 10–4 m/s back Aim
AimProblem Statement (3) Information on the relationship between the Q90 and a certain set of catchment descriptors can be gained by looking at other catchments in the same region for which both flow data and catchment descriptors are available. Q90 = ? By means of multiple regression analysis among the other qualifying catchments in this region, we may be able to find a common regional pattern which describes this relationship between catchment descriptors and the Q90. This equation is called the regional transfer function. Wiese Site of the proposed hydro-power plant Assuming that the same relationship is true for the Wiese catchment, we can use the regional transfer function and estimate the desired Q90 value at our ungauged site based on the respective Wiese catchment descriptors. Fig. 1.2 Wiese catchment (No. 532) Aim
AimProblem Statement (4) • In the Appendices we have provided additional information on the catchment descriptors, data sources, and references. • Let us now move on to get acquainted with the Study Area we will work with. • After a more theoretical section on the basics of the regression analysis Procedurewe will then come back to the Wiese catchment for the Application part of this self-guided tour in order to sole the stated problem. • We encourage you to also use the Data provided to seek to reproduce the regression analysis on your own. Aim
Study AreaOverview • The general study area is the State of Baden-Württemberg. Baden-Württemberg is located in the Southwest of the Federal Republic of Germany and shares a border with France in the West and Switzerland in the South. The region encompasses several landscapes, which exhibit a wide range of morphometry, hydro-geology, soil, land use, and climate. • You may click on either one of the light bulbs on the map to receive more information on the specific landscapes, • or choose from the following categories • Climate • Hydrology Karlsruhe Stuttgart Strasbourg (France) Freiburg Basel (Switzerland) N 100 km Fig. 1.1 Map of the study area Study Area
Study AreaRhine Rift Valley The Oberrheinische Tiefebene(Rhine Rift Valley) is a 300 km long and 20-30 km wide tectonic rift, which is filled with fluvio-glacial deposits. The river Rhine flows through the valley from South to North. It interacts with the sediments to form terraces, alluvial fans, gravel bars, etc.. It is here that the lowest elevations of the study area, 85 m to 250 m a.m.s.l., are found. The region is among the warmest in Central Europe, with mean air temperatures around 10°C, and it receives 600 to 900 mm rainfall per year. (BORCHERDT 1991). The favourable climate and fertile soil on extensive loess deposits are the basis for the high agricultural productivity of this region, where wine and fruit are grown (MOHR 1992). Karlsruhe Stuttgart Strasbourg (France) Freiburg Basel (Switzerland) N 100 km back toOverview Fig. 1.1 Map of the study area Study Area
Study AreaBlack Forest The Schwarzwald (Black Forest) is a mountain range, characterized by steep valleys on the West side toward the river Rhine and more gentle slopes on the Eastern side towards the Danube. The Northern and Eastern Schwarzwald has an average elevation of 600 to 800 m a.m.s.l. (highest peak: Hornisgrinde 1164 m a.m.s.l.) and is dominated by New Red Sandstone. Due to relatively permeable bedrock, the drainage network is not particularly dense. The Southern and Western part of the Schwarzwald is the most elevated part of the study area with mean elevations of 1000 m a.m.s.l.. Feldberg is the highest elevation in the study area with 1493 m a.m.s.l. and an average air temperature of 3.2 °C (BORCHERDT 1991). The area also receives the most precipitation in the study area; up to 2100 mm/year. Since the top bedrock is composed of granite and gneiss with relatively low permeability, a significant amount of water is drained on the surface and a dense drainage network with a mean drainage density of 1.94 km/km2 and a maximum of 5.0 km/km2 (WUNDT 1953) has developed. Karlsruhe Stuttgart Strasbourg (France) Freiburg Basel (Switzerland) N 100 km back toOverview Fig. 1.1 Map of the study area Study Area
Study AreaSüdwestdeutsches Schichtstufenland The Südwestdeutsches Schichtstufenland(literally: “Southwest German step-layered land”) is characterized by a relatively level to rolling topography, which is slightly tilted towards the South East. Its elevation ranges from 700 to 1000 m a.m.s.l.. Mean annual air temperatures range from 6 to 9°C. The region receives between 650 and 900 mm rainfall per year. The bedrock is composed of layers of sedimentary rocks, such as New Red Sandstone, Coquina, Keuper, and Jurassic, which exhibit karstic phenomena, such as dolines and sinkholes. Dry valleys are relics from periods of colder climate when the ground was frozen so that more water drained on the surface. Drainage density today may be as low as 0.03 km/km2 (WUNDT 1953). In some areas, limestone is covered with loess, which causes an increase in drainage density. New Red Sandstone is also found in this region in alternating layers with Marl. Due to differential erosion and an inclination of these layers a sequence of steps has been formed in the landscape. Karlsruhe Stuttgart Strasbourg (France) Freiburg Basel (Switzerland) N 100 km back toOverview Fig. 1.1 Map of the study area Study Area
Study AreaPre-Alps and Lake Constance The Alpenvorland (Pre-Alps) is an area where unconsolidated sediments have been re-arranged by glaciers. The area around Bodensee (Lake Constance) has been affected by the most recent (Würm) ice age, and has a quite pronounced relief with drumlins, lakes, and bogs of glacial origin. For the most part the area drains to Lake Constance, which is part of the river Rhine system. The lake is the result of glacial scouring. With a surface area of 538 km2 and a maximum depth of 254 m it is the largest German lake supplying Stuttgart and several other cities with drinking water. The Northern part of this landscape is a relic of the preceding (Riss) ice age and is therefore more levelled. Along the Danube, gravel with loess deposits can be found. The region lies at a mean elevation of 600 m a.m.s.l.. It receives 750 to 1400 mm precipitation and its mean annual air temperature is between 6 and 7°C. Karlsruhe Stuttgart Strasbourg (France) Freiburg Basel (Switzerland) N 100 km back toOverview Fig. 1.1 Map of the study area Study Area
Study AreaClimate (1) • The climate in the study area is the result of the interaction of oceanic and continental influences. While the latter is responsible for seasonality (with cold winters and hot summers), the dominating impact of the former leads to a more temperate climate. July is usually the warmest and January the coldest month. • The mean annual air temperature ranges from 3.2 °C at the Feldberg (highest elevation of the study area) to above 10°C in the Rhine Rift Valley (HUTTENLOCHER 1972). N Fig. 2.2 Mean annual precipitation (1961-90) [mm] more Study Area
Study AreaClimate (2) • Precipitation in this area is predominantly caused by frontal (zyklonal) storms. This pattern is modified by orographic lifting. Therefore, the amount of precipitation is mostly a function of elevation and exposition. It ranges from 2100 mm/year (in the Western part of the Black Forest, such as the Feldberg) to 600 mm/year (in the sheltered areas of the Rhine Rift Valley). • During the summer convective lifting may induce the formation of short-duration-high-intensity precipitation. The study area receives precipitation throughout the year with a maximum in the summer (June to August) and a minimum in the late winter (February and March). There is snow on the ground for up to 150 days in the Black Forest (HUTTENLOCHER 1972). N Fig. 2.2 Mean annual precipitation (1961-90) [mm] back toOverview Study Area
Study AreaHydrology • Three quarters of the study area is drained by the river Rhine (the only alpine river flowing to the North Sea) and one quarter by the Danube. Since the area draining into the river Rhine falls more steeply, backwards erosion allows its headwaters to tap into the Danube catchments. • It is difficult to map out the exact position of the European groundwater divide in this area since a significant amount of water drains in the karst system, part of which is diverted from the Danube into the Rhine (VILLINGER 1982). During low-flow periods, all the water from the Danube leaves the river bed between Immendingen and Fridingen through sink holes and continues to flow underground. Two thirds of this water ends up in the river Rhine system (BORCHERDT 1991). • With the lack of substantial tributaries and the loss of water to the river Rhine, the Danube remains a relatively small river until its alpine tributaries add to its flow in Bavaria, east of the study area. Rhine Danube Fig. 2.3 Catchments in Southwest Germany more Study Area
Study AreaDrainage Network and Human Impact • The previously-discussed variety of landscapes in Southwest Germany is reflected by the regional distribution of drainage density. It is easy to spot the low-laying Rhine Rift Valley as well as the Black Forest and the Pre-Alps, which receive the highest precipitation amounts in the study area. The high drainage density in these regions is indicated by the blue colours. In contrast, the Swabian Alb, part of the “Deutsches Schichtstufenland”, is easily distinguishable by the white shading. It has a very low drainage density, due to wide-spread karstic phenomena. • Water management measures, such as water diversions and exports, stormwater ponds, reservoirs for the augmentation of low flows and groundwater extraction, are examples of how the hydrological cycle is being quantitatively impacted by human activity in this area. For our example only catchments with little human impact on the flow regime have been selected. Fig. 2.4 Drainage density in Southwest Germany more Study Area
1 1 Study AreaRunoff Regimes • The runoff regime in this region is dominated by the effects of rainfall and modified to some degree by snow melt. The highest flows usually occur between February and April and the lowest in August or September due to a summer maximum of evapotranspiration. Figure 2.5 shows the Pardé coefficients (mean annual monthly flow divided by mean flow) for two catchments in our region, ranging between 0.5 in late summer and 2.0 in the spring. Breg (at Hammereisenbach) Elz (at Mosbach) 2 2 Fig. 2.5 Pardé coefficients back toOverview Study Area
ProcedureOutline Model Design (Step 2) Data Acquisition (Step 1) • Model Selection • Assumptions and Requirements Multiple Linear Regression ModelYi = b0 + bj * Xij + ei Catchment Selection • Selection of Catchment Descriptors • Deduction of Catchment Descriptors • Selection of Low-Flow Indices Calculation of Low-Flow Indices Data Splitting Calibration Data Set (56 Stations) Catchment Descriptors (independent variables) Low-Flow Indices (dependent variables) Model Calibration (Step 3) • Selection of Algorithms to depict the low-flow indices • Computation of Regional Transfer Functions BASE = b0 + bj * Xij + ei MAM(10) = b0 + bj * Xij + ei Q90 = b0 + bj * Xij + ei Validation Data Set (27 Stations) Catchment Descriptors (independent variables) Low-Flow Indices (dependent variables) Model Evaluation (Step 4) Model Validation (Step 5) • Check for Sensibleness • Model Requirements Check for agreement between observed and estimated values Model Application You may chose a specific step of the procedure or click on the arrows (bottom right) to proceed in sequence Procedure
ProcedureOutline Model Design (Step 2) Data Acquisition (Step 1) • Model Selection • Assumptions and Requirements Multiple Linear Regression ModelYi = b0 + bj * Xij + ei Catchment Selection • Selection of Catchment Descriptors • Deduction of Catchment Descriptors • Selection of Low-Flow Indices Calculation of Low-Flow Indices Data Splitting Calibration Data Set (56 Stations) Catchment Descriptors (independent variables) Low-Flow Indices (dependent variables) Model Calibration (Step 3) • Selection of Algorithms to depict the low-flow indices • Computation of Regional Transfer Functions BASE = b0 + bj * Xij + ei MAM(10) = b0 + bj * Xij + ei Q90 = b0 + bj * Xij + ei Validation Data Set (27 Stations) Catchment Descriptors (independent variables) Low-Flow Indices (dependent variables) Model Evaluation (Step 4) Model Validation (Step 5) • Check for Sensibleness • Model Requirements Check for agreement between observed and estimated values Model Application You may chose a specific step of the procedure or click on the arrows (bottom right) to proceed in sequence Procedure
1 Data AcquisitionOverview 1 • This preparatory step is foundational to the success of the whole analysis and estimation process. Our results can only be as good as the data we use for the basis of our calculations. Therefore, adequate resources and attention should be given to this crucial step. • The data used in the self-guided tour has been provided by different project groups and institutions, e.g. WaBoA, RIPS-Pool, LfU, LGRB (which are all part of the European Water Archive EWA), and the KLIWA project group. The applicable data associated with each of the respective catchments was entered into a two-dimensional spreadsheet, which can accessed through the Data Section • Click here to receive an explanation of the administrative acronyms Catchment Selection • Selection of Catchment Descriptors • Deduction of Catchment Descriptors • Selection of Low-Flow Indices Calculation of Low-Flow Indices Data Splitting Calibration Data Sets (56 Stations) Validation Data Sets (27 Stations) Catchment Descriptors (independent variables) Low-Flow Indices (dependent variables) Catchment Descriptors (independent variables) Low-Flow Indices (dependent variables) Procedure
1 Data AcquisitionAcronyms 1 • The data used in the self-guided tour were provided by the following data pools, projects, and organisations: • Data Pools • RIPS-Pool – Räumliches Informations- und Planungssystem (Spatial Information and Planing System, State of Baden- Württemberg) • EWA - European Water Archive of the Northern European FRIEND project (Flow Regimes from International and Experimental Data) • Projects • WaBoA – Wasser und Boden Atlas von Baden-Württemberg (Water and Soil Atlas of the State of Baden-Württemberg) • KLIWA – Projekt Klimaänderung und Konsequenzen für die Wasserwirtschaft (Climatic Change and Impact on Water Resources Management) • Organisations • LfU – Landesanstalt für Umweltschutz (Environmental Agency, Regional Office, State of Baden-Württemberg) • LGRB – Landesanstalt für Geologie, Rohstoffe und Bergbau Baden-Württemberg (Regional Office for Geology, Commodities, and Mining, State of Baden-Württemberg) back Procedure
1 Data AcquisitionCatchments 2 • In a first step, the catchments to be considered for the analysis must be selected. The catchments for this study were selected based on the following FRIEND EWA criteria: • Availability of continuous runoff data • Precision in gauging low-water runoff. Accurate low-flow measurements, are difficult to attain. According to MORGENSCHWEIS (1990), gauging errors of 10% are common, and may – in case of heavy vegetation in the river bed – even reach 30% (GLOS & LAUTERBACH 1972) • Negligible influence of human activity on low-water runoff • Negligible influence of glacial runoff on total streamflow • Availability of catchment descriptors • Based on these criteria, 83 medium-scale catchments were selected for this study (Figure 3.1). N 0 80 160 km Fig. 3.1 Spatial distribution of selected catchments Procedure
1 Data AcquisitionCatchment Descriptors - Overview 3 • The catchment descriptors are the dependent variables in the model to be established. They were selected based on the following criteria (HAAS 2000): • agreement with hydrological principles spatial representation with respect to climate, land use, morphometry, soil, and hydrogeology experience in using these independent variables in other studies availability for the study area relatively easycalculations possible interpretation as areal means • Click here to receive more information • on the catchments descriptors Tab. 1 Selected catchment descriptors Soil Percentage of soils with high infiltration capacity [%] Percentage of soils with medium infiltration capacity[%] Percentage of soils with low infiltration capacity[%] Percentage of soils with very low infiltration capacity [%] Mean hydraulic conductivity of the soils [cm/d] Percentage of soils with low hydraulic conductivity [%] Percentage of soils with high water-holding capacity in the effective root zone [%] Mean water-holding capacity in the effective root zone [mm] Hydrogeology Percentage of rock formations with a very low hydraulic permeability [%] Weighted mean of hydraulic conductivity [m/s] Climate Average annual precipitation [mm] Land Use Percentage of urbanisation [%] Percentage of forest [%] Morphometry Catchment area [km2] Drainage density [km/ km2] Highest elevation [m a.m.s.l.] Average elevation [m a.m.s.l.] Lowest elevation [m a.m.s.l.] Maximum slope [%] Average slope [%] Minimal slope [%] Procedure
1 Data AcquisitionCatchment Descriptors - Overview 3 • You may click on any of the categories on the right to receive more information on the catchment descriptors or click here to return. Climate Morphology and Morphometry Soil Land Use Hydrogeology Fig 3.2 Catchment Descriptors (PLATE 1992) Procedure
1 Data AcquisitionMorphology and Morphometry 3 • AREA - Catchment area [km2] • The catchment area is defined as the“area having a common outlet for its surface runoff” (IHP/OHP 1998). • The descriptor was deduced from a 1:50,000 scale map of catchment boundaries provided by the Water and Soil Atlas of the State of Baden-Württemberg (WaBoA) and the RIPS-Pool. • DD - Drainage density [km/km2] • Drainage density is the “total channel- segment length, accumulated for all [stream] orders within a drainage area, divided by the area” (IHP/OHP 1998). For the deduction procedure 1: 50,000 scale maps of catchment boundaries and drainage network (WaBoA and RIPS-Pool) were combined. HMIN – Lowest elevation [m a.m.s.l.] HMAX – Highest elevation [m a.m.s.l.] HMEAN – Average elevation [m a.m.s.l.] The elevation data are based on a digital elevation model (50 m by 50 m cells), provided by the Water and Soil Atlas of the State of Baden-Württemberg (WaBoA) and the RIPS-Pool. SLOPEMIN - Minimal slope [%] SLOPEMAX - Maximum slope [%] SLOPEMEAN - Mean slope [%] Minimum, maximum and mean slopes were deduced using a digital elevation model. back to Catchment Descriptors - Overview Procedure
1 Data AcquisitionLand Use and Hydrogeology 3 • Remote sensing was used to derive land use for the area (Landsat TM, 30 x 30 m grid, 1993). It was classified into 16 classes, which were aggregated to four groups; forest, farmland, grassland and settlements/urban areas. • Only the relative proportion of forest and urban areas were chosen to be included in this self-guided tour. • URBAN - Percentage of urbanisation [%] • FOREST - Percentage of forest [%] • URBAN is an aggregation of settlement areas and areas with large-scale surface sealing due to industry. The latter covers 0.8% of the study area. Settlements are comprised of loose (1.9%) and dense (4.6%) settlements. • FOREST is a combination of deciduous (7.8%) and coniferous (21.4%) forest and other forested areas (10.0%). GEOHCMEAN –Weighted mean of hydraulic conductivity [m/s] GEOVLHP – Percentage of rock formations with a very low hydraulic permeability [%] From a 1:350,000 scale map produced by the Regional Authority for Geology, Commodities, and Mining of Baden-Württemberg (LGRB), 98 geological classes were reduced to 54 hydro-geological classes and aggregated to eight groups. Each group was associated with a mean hydraulic conductivity of the upper hydro-geological unit. From these values, a weighted mean was produced for each catchment. From the same data, the proportion of rock formations with a mean hydraulic conductivity of less than 10-5 m/s was derived. back to Catchment Descriptors - Overview Procedure
1 Data AcquisitionSoil (1) 3 • The classification of the soil water regime was based on a study by the Regional Authority for Geology, Commodities, and Mining of Baden-Württemberg (LGRB). They produced a 1 : 350 000 scale map of 29 soil water regime classes based on soil type, humus content, packing, slope, and geology. • These classes were aggregated to four groups of soil types based predominantly on their infiltration capacity, which is defined as the “maximum rate at which water can be absorbed by a given soil per unit area under given conditions” (IHP/OHP 1998). • SOILH – Percentage of soils with high infiltration capacity [%] • These soils exhibit a high infiltration capacity even under conditions of high antecedent soil water content, such as sand and gravel soils. SOILM – Percentage of soils with medium infiltration capacity [%] Examples of soils which feature a medium infiltration capacity are loamy soils and loess of medium depth. SOILL – Percentage of soils with low infiltration capacity [%] The low infiltration capacity of these soils is due to their fine texture and/or the impermeability of one or more layers, as found in shallow sandy and loamy soils. SOILVL – Percentage of soils with very low infiltration capacity [%] The infiltration capacity in these soils is very low because they are shallow, composed of hardly permeable material (such as clay) or have a high ground water level. more back to Catchment Descriptors - Overview Procedure
1 Data AcquisitionSoil (2) 3 • SOILHCMEAN - Mean hydraulic conductivity • of the soils [cm/d] • SOILLHC - Percentage of soils with low • hydraulic conductivity [%] • Hydraulic conductivity is a “property of a saturated porous medium which determines the relationship, called Darcy’s law, between the specific discharge and the hydraulic gradient causing it” (IHP/OHP 1998). • From a 1 : 200 000 scale map with 9 classes, areal means were deduced. The lowest two classes (with a mean hydraulic conductivity of less than 2.3*10-6 m/s) were combined for the calculation of the percentage of soils with low hydraulic conductivity. • ROOTSMEAN - Mean water-holding capacity • in the effective root zone [mm] • ROOTSHIGH - Percentage of soils with high • water-holding capacity in the • effective root zone [%] The data for this descriptor is based on a map produced by the Regional Authority for Geology, Commodities, and Mining of Baden-Württemberg (LGRB), which shows the distribution of water-holding capacity for a theoretical soil depth of 100 cm. Water-holding capacity is defined as “water in the soil available to plants. It is normally taken as the water in the soil between wilting point and field capacity. In this context water-holding capacity is used and is identical to the available water” (IHP/OHP 1998). Based on the information of soil type, land use, root depth, and water logging conditions the water-holding capacity values were adjusted to the estimated effective root zone. These values were then used to compute the areal mean. A threshold mean water-holding capacity was set at 200 mm. Above this threshold, all classes were aggregated to “soils with high water-storage capacity in the effective root zone” and its proportion was calculated. back to Catchment Descriptors - Overview Procedure
1 Data AcquisitionClimate 3 • AAR – Average annual precipitation [mm] • The data for the average annual precipitation was derived from a digital map provided by the Water and Soil Atlas of the State of Baden-Württemberg (WaBoA) and the RIPS-Pool. It shows average annual precipitation for the period 1961-1990 based on a resolution of a 500 m grid. • For this map, average annual precipitation had been calculated from the relationship between precipitation depth and altitude. It was also based on the principle of distance-weighting from the points of measurement. The raw data for the production of this map was provided by the German Weather Service (DWD). N Fig. 2.2 Mean annual precipitation (1961-90) [mm] back to Catchment Descriptors - Overview Procedure
1 Data AcquisitionLow-Flow Indices 4 • Several low-flow indices have been developed to describe the statistical distribution of flow. The low-flow indices are the independent variables in our model. The estimation procedure was performed for the following three low-flow indices. • the mean base flow, BASE, • the mean annual 10-day-minimum flow, MAM(10), and • the 90 percentile runoff, i.e. the runoff to be equalled or exceeded 90% of the time, Q90. • The low-flow indices are calculated from daily flow data for the entire data set. Our regression analysis will be performed separately for all three dependent variables. You may use the arrow buttons to view the low-flow indices in sequence or proceed to the next section. Procedure
1 Data AcquisitionBASE 5 • The method of base flow estimation from daily flow data was developed by WUNDT (1958) and KILLE (1970) and modified by DEMUTH (1993). It serves as an example of how more complex indices can be obtained in an automated and objective way. • The approach is based on the analysis of monthly minimum flows. It assumes that for the most part monthly minimum flows are equivalent to the mean base flows of the respective months. Monthly minimum runoff values are extracted from a time series of at least ten years, and the individual values are ranked in an ascending order and plotted (Figure 3.3). • The points of the ranked flow data are similar to a flow duration curve with the lower values arranged approximately along a straight line. At the critical point the slope of the curve sharply increases. It is assumed that flows beyond the critical point are not “pure” base flow. Streamflow [m3/s] Rank Fig. 3.3 Monthly minimum runoff values, ranked in ascending order (Elsenz at Meckesheim, No. 460, 1966-90) Procedure
1 Data AcquisitionBASE 6 • A stepped linear regression is computed to find the line which separates the flow values which are influenced by surface and subsurface flow from “pure” base flow values (Figure 3.4). • The step regression starts with the values between the 5% and the 50% mark. Successively, values beyond the 50% mark are included in the regression and the correlation coefficient is re-computed until it reaches a maximum. This value is called the critical point. • Between the 5% value and the new critical point a straight line is interpolated and extended in both directions to correct the higher flows to “true” base flow. Finally, all flow values are adjusted to the straight line and the mean base flow is calculated (yellow arrows). critical value 5% value 50% value Streamflow [m3/s] BASE Rank Fig. 3.4 Monthly minimum runoff values, ranked in ascending order (Elsenz at Meckesheim, No. 460, 1966-90) Procedure
1 Data AcquisitionBASE 7 • The DEMUTH procedure can only be applied to the S-shaped curve (Type I). The parabolic curve (Type II) does not allow a linear reduction procedure. • In our data sets, all flow data belonged to type I and could be used for the deduction of BASE for the respective catchment. Type I Type II Streamflow[m3/s] Streamflow[m3/s] Rank Rank Fig. 3.5 Type I and Type II curves Procedure
1 Data AcquisitionMAM(10) 8 • The MAM(10) value is calculated by selecting the annual ten-day minimum values (AM(10)) of discharge from each year of the observation period and computing the arithmetic mean of this set of values (Figure 3.6). Streamflow [m3/s] Year Fig. 3.6 Annual 10-day minimum values of discharge and their arithmetic mean (Elsenz at Meckesheim, No. 460, 1966-90) Procedure
1 Data AcquisitionQ90 9 • In a Flow Duration Curve (FDC) the observed flow data is ranked in descending order. It displays the relationship between a discharge value and the percentage of time during which it is equalled or exceeded. • The Q90 is the value which is equalled or exceeded in 90% of the time, in this case 0.9 m3/s (Figure 3.7). Streamflow [m3/s] Percentiles Fig. 3.7 Flow Duration curve and deduction of the 90 percentile (Elsenz at Meckesheim, No. 460, 1966-90) Procedure
1 Data AcquisitionData Splitting 10 • The final step in preparing the data is to split the acquired data set arbitrarily in order to produce two sets for model calibration and validation, respectively. This is called Data Splitting. • It is advisable to split the data with a ratio of about 2 to 1, ensuring that both data sets reflect the physiographic properties of the region under study. • The Baden-Württemberg data set was split into 56 and 27 data sets for calibration and validation, respectively. Catchment Descriptors (independent variables) Low-Flow Indices (dependent variables) Data Splitting Validation Data Set (27 Stations) Calibration Data Set (56 Stations) Catchment Descriptors (independent variables) Low-Flow Indices dependent variables) Catchment Descriptors (independent variables) Low-Flow Indices (dependent variables) Procedure
ProcedureOutline Model Design (Step 2) Data Acquisition (Step 1 • Model Selection • Assumptions and Requirements Multiple Linear Regression ModelYi = b0 + bj * Xij + ei Catchment Selection • Selection of Catchment Descriptors • Deduction of Catchment Descriptors • Selection of Low-Flow Indices Calculation of Low-Flow Indices Data Splitting Calibration Data Set (56 Stations) Catchment Descriptors (independent variables) Low-Flow Indices (dependent variables) Model Calibration (Step 3) • Selection of Algorithms to depict the low-flow indices • Computation of Regional Transfer Functions BASE = b0 + bj * Xij + ei MAM(10) = b0 + bj * Xij + ei Q90 = b0 + bj * Xij + ei Validation Data Set (27 Stations) Catchment Descriptors (independent variables) Low-Flow Indices (dependent variables) Model Evaluation (Step 4) Model Validation (Step 5) • Check for Sensibleness • Model Requirements Check for agreement between observed and estimated values Model Application You may chose a specific step of the procedure or click on the arrows (bottom right) to proceed in sequence Procedure
2 Model DesignModel Selection 1 • In the self-guided tour, the multiple regression approach is chosen since it is easy to handle, produces fast results, and is an effective procedure in most statistics programs. • The purpose of multiple regression analysis, as defined by HOLDER (1985), is to “asses the combined effect of several variables on a single variable.” Thereby, the regression analysis allows for the recognition and interpretation of statistical relationships. • The understanding gained from this analysis can be used to estimate an independent variable based on several dependent variables. In our model, the independent variables are the catchment descriptors, and the dependent variables are the low-flow indices. By applying the regression approach we assume that the relationship between a low-flow index Y and its catchment descriptors X can be expressed as follows: Yi = b0 + bj * Xij + ei with i = 1, ..., N and j = 1, ..., P where Yi is the dependent variable and b0 and bj are constants or coefficients respectively. Xij signifies the catchment descriptor j of the catchment i. N is the total number of data sets (samples) and P is the total number of independent variables; finally, ei is the error term (DEMUTH 1993). P j = 1 Procedure
2 Model DesignAssumptions and Requirements 2 • In order for the multiple regression model to be the “best linear unbiased estimates” (LEWIS-BECK 1986) six assumptions have to be made. They become requirements when we want to make predictions based on this analysis: • You may click on any of the six assumptions, use the arrow buttons to view them in sequence, or proceed to the next section. 1. The model is free of specification error 2. The data set is free of measurementerror 3. Homoscedasticity: The variance of theerror term is constant for all values ofthe independent variables 4. The error term is neither auto-correlatednor correlated with the independentvariables 5. The error term follows normaldistribution 6. The model is free of multi-colinearity Procedure
2 Model DesignAssumptions and Requirements 3 • 1. The model is free of specification error • We must assume that • the independent variables Xi (e.g. catchment size, areal precipitation) are linearly related to the dependent variable Y (e.g. Q90), and their effect on Y is truly additive or multiplicative (depending on the model chosen). • all relevant independent variables have been included in the model while all irrelevant independent variables have been excluded (LEVIS-BECK 1986). • It is the responsibility of the modeller to use all available statistical and physical knowledge to minimize specification error. Tests for statistical significance aid in identifying variables that should not be in the model. 2. The data set is free of measurement error The model relies on the quality of the data. We must be confident that the variables Xi and Yi have been measured accurately. The fulfilment of this condition is problematic, particularly since low flows are usually associated with an error in the magnitude of 10 to 30% (GLOS & LAUTERBACH 1972). back toAssumptions - Overview Procedure
2 Model DesignAssumptions and Requirements 4 • 3. Homoscedasticity: The variance of the error term is constant for all values of the independent variables • The assumption of homoscedasticity is true when a plot of residuals versus predicted values of Y produces a horizontal band with uniform width (Figure 3.8). • If this condition is not met, the estimated indices will not have a minimal variance. Consequently, the general procedures related to t-test, F-test, and confidence intervals will not be valid anymore. Therefore, the evaluation of a regression model implies a proper investigation of the residuals or estimation error. StandardisedResiduals 0 Predicted Values of Y Fig. 3.8 Check for Homoscedasticity more Procedure
2 Model DesignAssumptions and Requirements 5 • 3. Homoscedasticity: The variance of the error term is constant for all values of the independent variables (continued) • If the plot is a tilted band with equal width (Figure 3.9) either an error has occurred in the calculations or the model fails to accurately model changes in Y. • In such a case transformation of Y or inclusion of polynomial terms of X in the model may prove as a remedy (HOLDER 1985). StandardisedResiduals 0 Predicted Values of Y Fig. 3.9 Check for Homoscedasticity more Procedure
2 Model DesignAssumptions and Requirements 6 • 3. Homoscedasticity: The variance of the error term is constant for all values of the independent variables (continued) • If the band does not have equal width (Figure 3.10), the variance of the error term is not constant. Reasons for this deviation may include the increase of variability with increasing Y or the increase of errors for greater Y. • This can be corrected through • the application of a weighted least squares procedure (LEWIS-BECK 1986), • a transformation of the variables, • elimination of part of the values, or • fitting several models to different ranges of values (HOLDER 1985). StandardisedResiduals 0 Predicted Values of Y Fig. 3.10 Check for Homoscedasticity back toAssumptions - Overview Procedure
2 Model DesignAssumptions and Requirements 7 • 4. The error term is neither auto-correlated nor correlated with the independent variables • If this condition is not met, significance tests and confidence intervals will be invalid (HOLDER 1985). • In cases where measurements were collected in a sequence or as part of a time series, it is possible that time (even though it is not specified as a separate independent variable) has an effect on the error term. This can be checked when error is plotted versus time or sequence number of measurements. If an (auto-)correlation is detected, the acquired data needs to be corrected with respect to time. a StandardisedResiduals 0 Time b StandardisedResiduals 0 Time Fig. 3.11 Assessment of the effect of time on the error term more Procedure
2 Model DesignAssumptions and Requirements 8 • 4. The error term is neither auto-correlated nor correlated with the independent variables (continued) • If a trend is visible (Figure 3.11-a) then time has explanatory value and should be included in the model. Possibly the measurement procedure has induced a systematic error over time or the property to be measured is undergoing a change. • It is also possible that the plot changes in width over time (Figure 3.11-b). This variability of the variance of the error can be a result of increased precision of the measuring technique over time (HOLDER 1985). a StandardisedResiduals 0 Time b StandardisedResiduals 0 Time Fig. 3.11 Assessment of the effect of time on the error term more Procedure
2 Model DesignAssumptions and Requirements 9 • 4. The error term is neither auto-correlated nor correlated with the independent variables (continued) • A correlation between the error term and an independent variable (Figure 3.12) may occur when a significant variable has been left out of the model and is now accounted for partially by the error term and partially by the other independent variables. (LEWIS-BECK 1986). • If an independent variable and the error term are correlated “the least squares parameter estimates will be biased” (LEWIS-BECK 1986). StandardisedResiduals 0 Values of X Fig. 3.12 Assessment of correlation between the error term and an independent variable back toAssumptions - Overview Procedure
2 Model DesignAssumptions and Requirements 10 • 5. The error term follows normal distribution • The fulfilment of this requirement can be assessed visually by comparing a histogram of the residuals (Figure 3.13) or a cumulative distribution of the error term (Figure 3.14) to the expected normal distribution, or mathematically by computing skewness. • Since the X values are fix it can be implied that a normal distribution of the error term corresponds to a normal distribution of Y (LEWIS-BECK 1986). This means that for a fulfilment of the assumption the data used in the regression analysis also needs to follow near-normal distribution. Frequency 0 Residuals Fig. 3.13 Frequency distribution of residuals Predicted cumulative probability of residuals Observed cumulative probability of residuals back toAssumptions - Overview Fig. 3.14 Probability plot of residuals Procedure
2 Model DesignAssumptions and Requirements 11 • 5. The error term follows normal distribution • (continued) • If the error term is not normally distributed tests of significance and confidence interval statements will become questionable. However, “the tests of significance appear to be insensitive to non-normality in Y whenever the Xs themselves come from a near-normal distribution. On the other hand, if the Xs themselves do not come from a near-normal distribution and if some X values are very different in magnitude from the remainder, then the tests of significance are very sensitive to non-normality in Y” (LEWIS-BECK 1986). Frequency 0 Residuals Fig. 3.13 Frequency distribution of residuals Predicted cumulative probability of residuals Observed cumulative probability of residuals back toAssumptions - Overview Fig. 3.14 Probability plot of residuals Procedure
2 Model DesignAssumptions and Requirements 12 • 6. The model is free of multi-colinearity • Multi-colinearity means that one independent variable can be expressed as a linear combination of the remaining independent variables in the model. • This is problematic because it produces large variances for the slope estimates resulting in large standard errors so that parameter estimates become unreliable (LEWIS-BECK 1986). Furthermore, multi-colinearity complicates the interpretation of the regression equation. (SCHREIBER 1996). • To detect multi-colinearity each independent variable is regressed on all other independent variables of the model (LEWIS-BECK 1986). DEMUTH (1993) uses 0.8 as the upper limit for the coefficient of determination. Variable combinations that are more strongly inter-correlated must be devised. The problem of multi-colinearity can be addressed by enlarging the sample size or by combining the problematic variables to forma single indicator (e.g. through principle component analysis). The third option, excluding the problematic variable, introduces specification error to the model (see assumption 1)! Comparing the new (reduced) model with the original model can help in the assessment of the significance of this error (LEWIS-BECK 1986). The seriousness of violations of the above assumptions is argued controversially in scientific literature. What can be said is that there are different degrees of robustness among the above conditions. For example, while the assumption of normality (5) is relatively robust for large samples, specification errors (1) generally cause grave problems (LEWIS-BECK 1986). back to Assumptions – Overview Procedure