Download
1 / 29
290 likes | 447 Vues
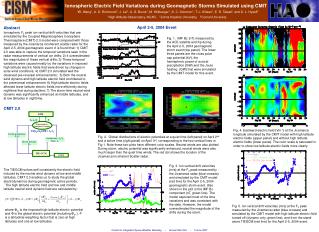
Simulated RF Signals in the GPS L1 and L2 Bands During Severely Disturbed Ionospheric Conditions. CHARLES S. CARRANO*, KEITH M. GROVES † , MICHAEL W. VERLINDEN † , AND RONALD G. CATON † *Institute for Scientific Research, Boston College, Chestnut Hill, MA (charles.carrano@bc.edu)

E N D
Simulated RF Signals in the GPS L1 and L2 BandsDuring Severely Disturbed Ionospheric Conditions CHARLES S. CARRANO*, KEITH M. GROVES†, MICHAEL W. VERLINDEN†, AND RONALD G. CATON† • *Institute for Scientific Research, Boston College, Chestnut Hill, MA (charles.carrano@bc.edu) † Space Vehicles Directorate, Air Force Research Laboratory, Hanscom AFB, MA VERSION 3 December 7, 2010
Scenario for the RF Signal Simulation GPS receiver location: Ascension Island in the Atlantic Ocean • Date/Time: 13 March 2002 (GPS Week 1175), 22:11:48 – 22:26:48 UTC • Sample rate: 100 Hz, Total Samples = 15 min * 60 sec/min * 100 Hz = 90000 samples • At this time, the following 7 GPS satellites were visible from this location: • PRN 04, PRN 07, PRN 08, PRN 24, PRN 26, PRN 27, PRN 28 • Our simulated C/No includes scintillation effects superimposed on a trend due to satellite range. • Our simulated phase includes scintillation effects plus the refraction effect due to line of sight TEC. The accumulated phase due to the satellite’s range from the receiver is not included. 2
The Simulated RF Signal Datafiles For convenience, we created both ASCII and Binary versions of the simulated signals for each GPS PRN. The ASCII and Binary files contain the same information. The technique we used to generate this simulated data will be described elsewhere. Please note, however, that the technique works best when the satellite elevation is above 30. Hence, the simulated data for PRNs 24 and 26 is less realistic than for the other PRNS. 2
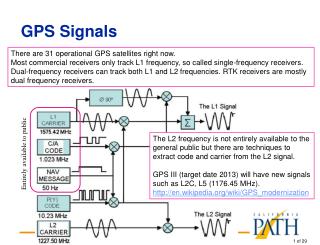
Subdividing the Bandwidth of the GPS Signals C/A code M code P(Y) code We chose to simulate 19 frequencies within a 30 MHz Band around the L1 and L2 carriers: where 3
Format of the ASCII Data Files (simulated_prnxx.txt) 19 frequencies within L1 band 19 frequencies within L2 band Col 1 2 3 4 5 6 7 … 72 73 74 75 76 77 • Column-delimited data (UNIX newline convention): • Column 1: UT (hours) • Columns 2-39: C/No (dB-Hz) and Phase (rad) at each of the 19 frequencies, , in the L1 band • Columns 40-77: C/No (dB-Hz) and Phase (rad) at each of the 19 frequencies, , in the L2 band • Total number of columns: 77 • Total number of rows (one for each time epoch), not including the two header lines = 90000 4
Format of the Binary Data Files (simulated_prnxx.dat) • Little-Endian Format • For each time epoch: • 4-byte unsigned long: Milliseconds of GPS week • 4-byte float C/No (dB-Hz) • 4-byte float Phase (rad) • … • 4-byte float C/No (dB-Hz) • 4-byte float Phase (rad) • … • Number of bytes per time epoch: 4*(1 + 2*19 + 2*19) = 308 bytes • Total number of bytes in file: (308 bytes/time epoch) * (90000 time epochs) = 27720000 bytes Repeated for each of the 19 frequencies, , in the L1 band Repeated for each of the 19 frequencies, , in the L2 band See also the included C program “read_simulated.c” which demonstrates how to read this data 5
PRN 04 – Elevation 57, Veff 147 m/s L1 Center Frequency L2 Center Frequency 6
PRN 07 – Elevation 47, Veff 91 m/s L1 Center Frequency L2 Center Frequency 7
PRN 08 – Elevation 70, Veff 88 m/s L1 Center Frequency L2 Center Frequency 8
PRN 24 – Elevation 21, Veff 32 m/s L1 Center Frequency L2 Center Frequency 9
PRN 26 – Elevation 10, Veff 93 m/s L1 Center Frequency L2 Center Frequency 10
PRN 27 – Elevation 36, Veff 13 m/s L1 Center Frequency L2 Center Frequency 11
PRN 28 – Elevation 33, Veff 59 m/s L1 Center Frequency L2 Center Frequency 12
Contact Information For questions about this simulated RF dataset please contact: Charles Carrano Institute for Scientific Research, Boston College 140 Commonwealth Avenue Chestnut Hill, MA 02467-3862 voice:(617) 552-8760 fax:(617) 552-2818 Charles.Carrano@bc.edu http://www2.bc.edu/~carranoc or contact: Keith Groves (Keith.Groves@Hanscom.af.mil) Mike Verlinden (Mike.Verlinden@Hanscom.af.mil) Ronald Caton (Ronald.Caton@Kirtland.af.mil) 13
Simulation Details In the following slides, we compare our simulated GPS C/No and phase with the GPS observations from which they were derived. The original GPS observations themselves contain multiple data gaps due to loss of lock and hence cannot be used directly for GPS receiver testing. 13