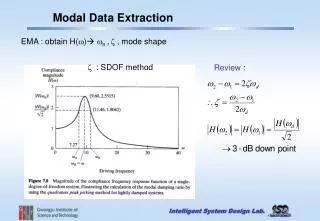
Modal Data Extraction
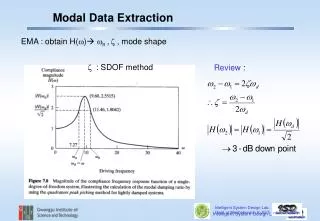
Modal Data Extraction. EMA : obtain H( w ) w n , z , mode shape. Review :. z : SDOF method. Intelligent System Design Lab. Dept. of Mechatronics, K-JIST. Modal Parameters by circle fitting. Nyquist plot : Plot of Re[H( w )] versus Im[H( w )] mobility FRF.

Modal Data Extraction
E N D
Presentation Transcript
Modal Data Extraction EMA : obtain H(w) wn ,z , mode shape Review : z : SDOF method Intelligent System Design Lab. Dept. of Mechatronics, K-JIST Intelligent System Design Lab.
Modal Parameters by circle fitting Nyquist plot : Plot of Re[H(w)] versus Im[H(w)] mobility FRF Intelligent System Design Lab. Dept. of Mechatronics, K-JIST Intelligent System Design Lab.
Intelligent System Design Lab. Dept. of Mechatronics, K-JIST Intelligent System Design Lab.
receptance (compliance) TF mobility TF accelerance (inertance) TF In resonance, Also Intelligent System Design Lab. Dept. of Mechatronics, K-JIST Intelligent System Design Lab.
Example 7.4.1 Consider the experimentally determined compliance transfer function plotted in Figure 7.9 and calculate the number of degrees of freedom, modal damping ratios, and natural frequencies. Solution Since the magnitude plot indicates two distinct peaks, the test system is assumed to have two degrees of freedom. This is confirmed by examining the phase plot at the peaks. Since the phase is at each peak, each of the peaks corresponds to a natural frequency. Reading the vertical axis yields Next since the 3-dB down points are those two values of w where Intelligent System Design Lab. Dept. of Mechatronics, K-JIST Intelligent System Design Lab.
Example 7.4.1 From the plot, these values yield and Using equation (7.14) yields Repeating this procedure for the second peak yields Intelligent System Design Lab. Dept. of Mechatronics, K-JIST Intelligent System Design Lab.
Nyquist Plot Intelligent System Design Lab. Dept. of Mechatronics, K-JIST Intelligent System Design Lab.
Mode Shape Measurement Intelligent System Design Lab. Dept. of Mechatronics, K-JIST Intelligent System Design Lab.
Mode Shape Measurement Intelligent System Design Lab. Dept. of Mechatronics, K-JIST Intelligent System Design Lab.
Mode Shape Measurement : transfer function between response at s and input force at r For Intelligent System Design Lab. Dept. of Mechatronics, K-JIST Intelligent System Design Lab.
Example 7.6.1 ,similar results can be obtained from Intelligent System Design Lab.
Example 7.6.1 Intelligent System Design Lab.
Example 7.6.1 Intelligent System Design Lab.
Fourier Transform Intelligent System Design Lab.