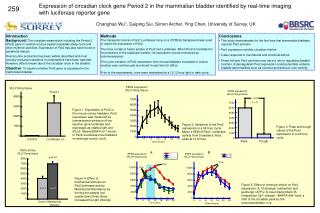
Comparative Analysis of Introns and Exons Across Multiple Species
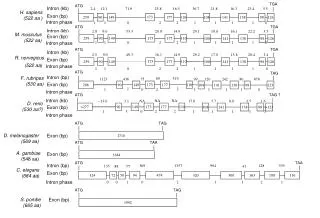
This analysis explores the genomic structure of various organisms, focusing on the dynamic interplay of introns and exons. It includes detailed measurements of intron lengths in kilobases (kb), the arrangement of coding regions (exons), and the phase classification of introns across several species, including *Homo sapiens*, *Mus musculus*, *Rattus norvegicus*, *Fugu rubripes*, *Danio rerio*, *Drosophila melanogaster*, *Anopheles gambiae*, *Caenorhabditis elegans*, and *Schizosaccharomyces pombe*. These insights are critical for understanding gene evolution and regulation.

Comparative Analysis of Introns and Exons Across Multiple Species
E N D
Presentation Transcript
TGA ATG Intron (kb) 2.4 12.1 71.9 25.8 16.5 36.7 21.8 16.3 23.4 5.5 H. sapiens (522 aa ) Exon (bp) 259 90 149 173 177 110 108 141 138 98 126 Intron phase 1 1 0 2 2 1 1 1 1 0 ATG TGA Intron (kb) 2.8 9.0 53.3 20.8 14.9 29.1 18.0 16.1 22.2 3.5 M. musculus (522 aa) Exon (bp) 259 90 149 173 177 110 108 141 138 98 126 Intron phase 1 1 0 2 2 1 1 1 1 0 ATG TGA Intron (kb) 2.5 9.0 49.3 16.1 14.9 29.2 17.0 13.8 20.4 3.4 R. norvegicus (522 aa) Exon (bp) 259 90 149 173 177 110 108 141 138 98 126 Intron phase 1 1 0 2 2 1 1 1 1 0 ATG TAG Intron (bp) F. rubripes (530 aa) 89 519 1123 436 75 99 120 242 80 878 Exon (bp) 286 90 149 173 177 110 108 141 138 98 123 1 2 1 0 2 1 1 1 1 0 Intron phase ATG TAG ? Intron (kb) NA NA ~13.0 3.1 NA 17.0 5.7 8.0 3.5 1.6 D. rerio (530 aa?) >277 90 149 173 177 110 108 141 138 98 >123 Exon (bp) 1 2 1 0 2 1 1 1 1 0 Intron phase ATG TAG D. melanogaster (569 aa) 1710 Exon (bp) ATG TAA A. gambiae (548 aa) Exon (bp) 1644 ATG TAA Intron (bp) 369 1357 994 128 535 135 88 57 41 C. elegans (684 aa) Exon (bp) 324 72 50 94 474 320 300 163 188 116 Intron phase 0 0 1 0 2 1 1 2 1 ATG TAG S. pombe (665 aa) Exon (bp) 1992