Download
1 / 12
130 likes | 273 Vues
Lec 4, Ch 3, pp.43-58 Characteristics of the User and the Vehicle (Objectives). Know four critical components of the traffic system Know there is considerable variability in the component characteristics – Traffic engineering is not an exact science

E N D
Lec 4, Ch 3, pp.43-58 Characteristics of the User and the Vehicle (Objectives) • Know four critical components of the traffic system • Know there is considerable variability in the component characteristics – Traffic engineering is not an exact science • Know what user characteristics are critical for driving • Know static and kinematic characteristics of vehicles affect the design of roads
What we cover in this lecture… • Four components affecting the traffic system • Variability in the components • The human response process • Perception-reaction process • Pedestrian characteristics • Static characteristics of vehicles affecting road design • Kinematic characteristics – Acceleration capability
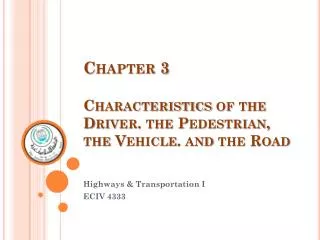
Roads Drivers Four components affecting the traffic system Pedestrians Vehicles Control Devices General Environment
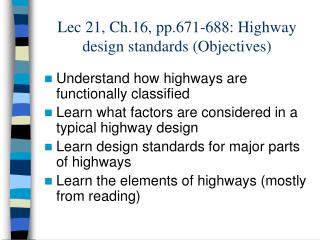
Variability among the users • Variability among the drivers is the most concerned one • Average values miss 50% of the driver population the 85th percentile often used (meaning that at least 85% of the user population must be safely covered) 85% Cumulative percentage • Examples: • Speed limit = Use the 85th percentile speed of the sampled speeds • Pedestrian walking speed = Use the 15th percentile speed of the sampled pedestrian walking speeds (Can you tell why the 15th percentile is used?) Speed
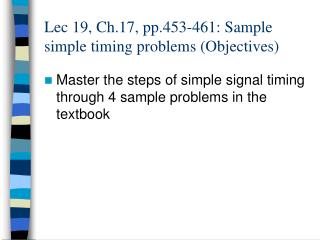
The human response process Ability to see: • Static visual acuity • Dynamic visual acuity • Depth perception • Glare vision & recovery • Color vision • Peripheral vision (120-180 deg) Clear vision cone (3-5 deg) Fairly clear (10-12 deg)
Perception-Reaction Process PRT = Perception + Reaction = (Detection + Identification + Decision making) + (Time needed to initiate the physical response) PIER = Perception + Identification + Emotion + Reaction (or volition) PIER = f (Complexity of the task, Level of expectancy, Variability of the drivers)
PIER Distance Reaction Dist. (ft or meter) = Speed (ft/sec or m/sec)* PRT (sec) How far does the car travel during the perception-reaction process? Affects sight distance requirement, sign placement, signal timing, etc. Example 3.1 (modified): Is this frog in crisis? 65 mph PIEV = 2.5 sec 190 ft away Speed = 65 mph = 65 x (5280 ft/3600sec) = 95.55 ft/sec Distance traveled during PIEV = 95.55*2.5 = 238.9 ft> 190 ft
Pedestrian characteristics • Affects the design of pedestrian facilities and pedestrian control devices (pedestrian signal and yellow-all red interval) • Walking seed most critical – Variability exists 4ft/sec2 is used typically.
Vehicle characteristics - Static • Size: Width, Length, Height, Overhang, Wheelbase Affect lane width, vertical space under a bridge, tunnel, etc., and Turning characteristics (off-tracking) • Weight Affect pavement design Max allowable truck size and weight See page 48 for specific values More discussion in CE561
Off-Tracking Problem Fig. 3-2
Acceleration Capability Acceleration characteristics: Affect • Laying out passing zones • Freeway acceleration lanes • Intersection sight distance Acceleration capability = f (Speed of vehicle) Usually maximum acceleration rate decreases as speed goes up.
Derivation of acceleration related formulas Open page 50. Use the textbook Constant acceleration case you learned it in physics. (eq. 3.4, 3.5, and 3.6)