Download
1 / 35
350 likes | 780 Vues
Web-based Tools for Monitoring Drought Nationwide. Phillip Pasteris USDA/NRCS National Water and Climate Center Portland, OR http://www.wcc.nrcs.usda.gov ppasteris@wcc.nrcs.usda.gov http://enso.unl.edu/monitor/index.html ftp://ftp.wcc.nrcs.usda.gov/pub/outgoing/crwmg.ppt.

E N D
Web-based Tools for Monitoring Drought Nationwide Phillip Pasteris USDA/NRCS National Water and Climate Center Portland, OR http://www.wcc.nrcs.usda.gov ppasteris@wcc.nrcs.usda.gov http://enso.unl.edu/monitor/index.html ftp://ftp.wcc.nrcs.usda.gov/pub/outgoing/crwmg.ppt
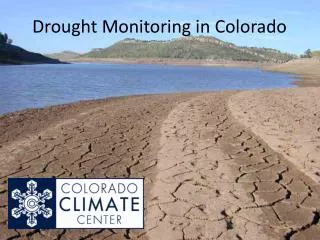
What is the Drought Monitor? The Drought Monitor is a compendium of information used to assess drought. It provides a one-stop shopping mall to observe the many facets of drought and its impacts on the U.S. It is a consensus opinion of federal and academic scientists. The product will be refined over time as we find ways to make it better reflect the needs of decision makers who use the information.
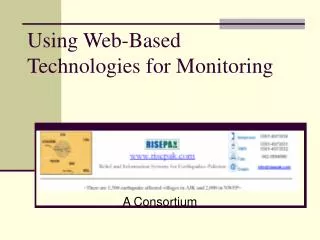
Where do I Find it? http://enso.unl.edu/monitor/index.html Updated every Thursday at 830 am ET.
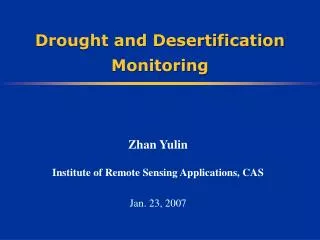
Tracking drought blends science and art. No single definition of drought works for all circumstances People rely on drought indices to detect and measure droughts. No single index works under all circumstances. The Drought Monitor is a synthesis of multiple indices, outlooks and news accounts How do you Assess Drought?
Federal Partners Joint Agricultural Weather Facility (U.S. Department of Agriculture) Department of Commerce/National Oceanic and Atmospheric Administration Climate Prediction Center (U.S. Department of Commerce/NOAA/National Weather Service) National Climatic Data Center (DOC/NOAA)
Academic partner National Drought Mitigation Center (University of Nebraska-Lincoln)
Other Partners U.S. Geological Survey (U.S. Department of Interior) National Water and Climate Center (USDA/Natural Resource Conservation Service) Climate Diagnostics Center (DOC/NOAA) Regional Climate Centers National Weather Service Hydrology (DOC/NOAA) State Climatologists Additional local, state and federal experts
Key Audiences National Weather Service Farm Service Agency, U.S. Department of Agriculture State water agencies and other resource management institutions and organizations The Weather Channel and other specialized media general media and the general public
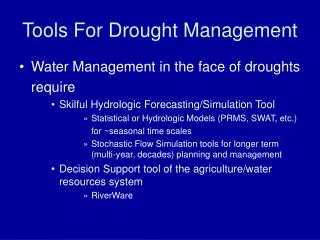
What Tools Are Available? Palmer Drought Severity Index Crop Moisture Index Standardized Precipitation Index Drought Impacts Map Percent of Normal Rainfall Daily Streamflow
Seasonal Snowpack and Precipitation Water Supply Forecasts Surface Water Supply Index Soil Moisture Topsoil Moisture vs. 5 Year Mean Vegetation and Temperature Conditions Current and Forecast Precipitation What Tools Are Available?
Drought Classifications Water (W), Agriculture (A), Wildfire Danger (F) Category, Description, Possible Impacts D0, Abnormally Dry, Going into drought: short-term dryness slowing planting, growth of crops or pastures; fire risk above average. Coming out of drought: some lingering water deficits; pastures or crops not fully recovered. D1, Moderate Drought, Some damage to crops, pastures; fire risk high; streams, reservoirs, or wells low, some water shortages developing or imminent, voluntary water use restrictions requested
D2, Severe Drought, Crop or pasture losses likely; fire risk very high; water shortages common; water restrictions imposed D3, Extreme Drought, Major crop/pasture losses; extreme fire danger; widespread water shortages or restrictions D4, Exceptional Drought, Exceptional and widespread crop/pasture losses; exceptional fire risk; shortages of water in reservoirs, streams, and wells, creating water emergencies Drought Classifications
In Conclusion Results are promising Managers are using the product - Internet availability Need more real-time data transmitted in SHEF to UCAN Weekly spatial analysis possible - PRISM technology Weekly WSF were produced in many Western basins Climate extremes more frequent and rapid shifts possible We’ll be ready