Download
1 / 28
330 likes | 759 Vues
Methodology for Electromigration Signoff in the Presence of Adaptive Voltage Scaling. Wei-Ting Jonas Chan , Andrew B. Kahng and Siddhartha Nath VLSI CAD LABORATORY, UC San Diego. Outline. Motivation Previous Work Analysis Models Experimental Setup and Results Conclusions.

E N D
Methodology for Electromigration Signoff in the Presence ofAdaptive Voltage Scaling Wei-Ting Jonas Chan, Andrew B. Kahng and Siddhartha Nath VLSI CAD LABORATORY, UC San Diego
Outline • Motivation • Previous Work • Analysis Models • Experimental Setup and Results • Conclusions
Bias Temperature Instability (BTI) |ΔVth| increases when device is on (stressed) |ΔVth| is partially recovered when device is off (relaxed) |Vgs| time ON OFF ON OFF Device aging (|ΔVth|) accumulates over time NBTI: PMOS PBTI: NMOS [VattikondaWC06]
Electromigration in Interconnects • Electromigration (EM) is the gradual displacement of metal atoms in an interconnect • Iavg causes DC EM and affects power delivery networks • Irms causes AC EM and affects clock and logic signals
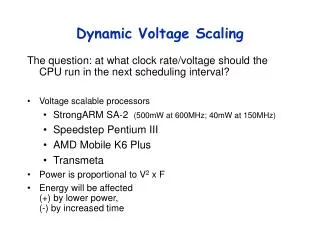
Adaptive Voltage Scaling (AVS) • Accumulated BTI higher |ΔVth| slower circuit • AVS can compensate for performance degradation Circuit performance Without AVS Circuit On-chip aging monitor With AVS target time Voltage regulator Circuit performance Vdd Closed-loop AVS time
BTI + AVS Signoff • Ensure circuit meets timing requirements under BTI aging • Use AVS to offset BTI degradation Step 1 Step 2 Step 3 VBTI |Vt| Derated library Circuit implementation and signoff Vlib ? Vfinal BTI degradation and AVS netlist Signoff loop of BTI
EM + BTI + AVS Signoff? • Aggressive AVS scheduling results in more severe degradation • Guardband during implementation increases due to degradation Stress on Wires EM loop Vfinal Design Implementation BTI loop Derated Libraries Vlib , VBTI Signoff loop of BTI + EM • How to signoff for EM with AVS? • What are area, power costs? • What is the impact to EM lifetime?
Outline • Motivation • Previous Work • Analysis Models • Experimental Setup and Results • Conclusions
Previous Works • EM lifetime and wire degradation models • Closed-form lifetime models (Black, Arnaud et al., Federspiel et al.) • Statistical model for wire degradation (Mishra et al.) • Claim their model reduces pessimism in Black’s Equation • EM-durable circuits • Wire-sizing algorithms (Adler et al., Jiang et al.) • Wire segmentation and via insertion algorithms (Li et al.) • Current-aware routers (Lienig et al., Yan et al.) • BTI Signoff • Interactions between AVS and BTI (Chan et al., Chen et al., Basoglu et al.) No studies on three-way interactions between BTI, EM and AVS!!!
Outline • Motivation • Previous Work • Analysis Models • Experimental Setup and Results • Conclusions
EM Model: Black’s Equation • EM degrades interconnect lifetime • Black’s Equation calculates lifetime of interconnect segment due to EM degradation • t50 – median time to failure (= loge 2 x MTTF) • A* – geometry-dependent constant • J – current density in interconnect segment • n – constant ( = 2) • Ea – activation energy of metal atoms • k – Boltzmann’s constant • T – temperature of the interconnect
New EM Model: Mishra-Sapatnekar • Models resistance increase due to voids in wires instead of MTTF • Derived from statistical model of nucleation and growth time Log-normal distribution • – Resistance increase due to voids in wires • – Resistivity of copper Tantalum liner • , – Cross section area of of copper and Tantalum liners • , – Length of void and wire • – Diffusivity during void growth period • – Effective charge number • – observation time and length of nucleation
New EM Model: Impact on Signal Wires • Sweep different gate sizes up to 8× • Larger gates do not necessarily help to reduce EM impact • ∼8% delay degradation for buffers smaller than 4× when resistance increases to high values (∼146%) Statistical model is optimistic in predicting delay penalties
New EM Model: Impact on Signal Wires • Sweep FO4 capacitive load by factors {1.0×, 1.6×, 2.1×} • EM slows down circuit performance due to • increased stage delay • increased output transition times Delay increases by ~35% with large resistance increase ~200%
Outline • Motivation • Previous Work • Analysis Models • Experimental Setup and Results • Conclusions
Experimental Setup • Multiple implementations based on different signoff corners • AES and DMA designs from Opencores • 28nm foundry FDSOI technology • Commercial tool-based SP&R flows • Synopsys PrimeTime for timing analysis • Matlab for AVS simlulation with BTI and EM
AVS Signoff Corner Selection • Characterize different derated libraries against BTI • Evaluate impact of library characterization • Vfinal is predicted by cell chains ahead of implementation • Eight implementations • 1 : VBTI = Vlib= Vmin Ignore AVS • 2 : Most pessimistic deratedlibrary • 3 : VBTI = Vlib= Vmax Extreme corner for AVS • 4: No derated library (reference) • 5 : Sweep around Vfinal • 6: Vfinalby cell chain prediction [ChanCK13] • 7: Sweep around Vfinal • 8 : Sweep around Vfinal
AVS Signoff Corner Selection Optimistic about AVS Pessimistic about AVS
Vfinal (V) AVS Impact on EM Lifetime • Assume no EM fix at signoff • BTI degradation is checked at each step and MTTF is updated as 30% MTTF penalty 200mV voltage compensation
Power Penalty to Fix EM with AVS • Core power increases due to elevated voltage • P/G power increases due to both elevated voltage and mesh degradation • A tradeoff between invested guardband in signoff 14% power penalty Least invested guardband Highest invested guardband
EM Impact on AVS Scheduling • AVS behavior is an important role to decide the EM penalty on lifetime • We empirically sweep AVS voltage step size to obtain the impact • #Implementation 3 is used • AVS starts at 0.9V, and no EM fix for AVS in signoff • 5 step sizes • S1 = 8mV • S2 = 10mV • S3 = 15mV • S4 = 18mV • S5 = 20mV
EM Impact on AVS Scheduling 1.2 years MTTF penalty
Outline • Motivation • Previous Work • Analysis Models • Experimental Setup and Results • Conclusions
Conclusions • We study the joint impact of BTI, AVS and EM on signoff • We study two EM models and their impact on implementation (i) Black’s Equation and (ii) Mishra-Sapatnekar • We demonstrate empirical results for lifetime, area and power penalty due to EM when AVS is involved • Up to 30% lifetime penalty • We demonstrate empirical results for power at different signoff corners • Up to 14% power penalty • Ongoing • Improve accuracy of signoff using a temperature gradient • Learning-based modeling to quantify design costs of reliability
EM Model: Mishra-Sapatnekar Log-normal distribution
Study on EM Impact in AVS System • Assume two types of degradation • IR drop due to power mesh degradation (∆RPGdue to EM) • Signal wire degradation due to EM Vregulator ∆RPG (due to EM) Mesh and ring Core (VDD domain)