Rate-Base Method for Packed Columns
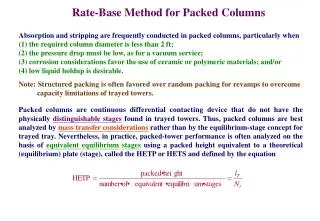
Rate-Base Method for Packed Columns. Absorption and stripping are frequently conducted in packed columns, particularly when (1) the required column diameter is less than 2 ft; (2) the pressure drop must be low, as for a vacuum service;

Rate-Base Method for Packed Columns
E N D
Presentation Transcript
Rate-Base Method for Packed Columns Absorption and stripping are frequently conducted in packed columns, particularly when (1) the required column diameter is less than 2 ft; (2) the pressure drop must be low, as for a vacuum service; (3) corrosion considerations favor the use of ceramic or polymeric materials; and/or (4) low liquid holdup is desirable. Note: Structured packing is often favored over random packing for revamps to overcome capacity limitations of trayed towers. Packed columns are continuous differential contacting device that do not have the physically distinguishable stages found in trayed towers. Thus, packed columns are best analyzed by mass transfer considerations rather than by the equilibrium-stage concept for trayed tray. Nevertheless, in practice, packed-tower performance is often analyzed on the basis of equivalent equilibrium stages using a packed height equivalent to a theoretical (equilibrium) plate (stage), called the HETP or HETS and defined by the equation
assuming dilute solutions such that Gl=Gin=Gout=G and Ll=Lin=Lout=L for the absorber for the stripper
~For the case of absorption, with mass transfer of the solute from the gas stream to the liquid stream, the two-film theory can be applied as illustrated in Figure 6.30. ~A concentration gradient exists in each film. ~At the interface between the two phase, physical equilibrium is assumed to exist. ~As with trayed tower, an operating line and an equilibrium line are of great importance in a packed column. ~For a given problem specification, the location of the two lines is independent of whether the tower is trayed or packed. ~The method for determining the minimum absorbent liquid or stripping vapor flow rates in a packed column is identical to the method for trayed tower. The rate of mass transfer per unit volume of packed bed is a represents the area for mass transfer per unit volume of packed bed.
The composition of the interface depends on the ratio, kxa/kya, of the volumetric mass transfer coefficients mass transfer resistance entirely in liquid phase slight solubility; high K-value mass transfer resistance entirely in gas phase strong solubility; low K-value 了解質傳阻力來自哪一相是相當重要,如此才能增加在哪一相內turbulence或增加哪一相之dispersion以強化質傳速率。 AE is the gas-phase driving force (y-yI) AF is the liquid-phase driving force (x-xI) y*與x平衡;x*與y平衡 Theslope -kxa/kya, determines the relative resistances of the two phase to mass transfer. K為平衡直線之斜率,同時也是溶質的K-value
For a dilute system, a differential material balance for the solute over a differential height of packing dl, gives: S is the cross-sectional area of the tower. ~HOG is the overall height of a transfer unit (HTU) based on the gas phase. Experimental data show that the HTU varies less with G than Kya. The smaller the HTU, the more efficient is the contacting. ~NOG is the overall number of transfer units (NTU) based on the gas phase. It represents the overall change in solute mole fraction divided by the average mole fraction driving force. The larger the NTU, the greater is the extent of contacting required.
A>1, NTU>Nt A=1, NTU=Nt A<1, NTU<Nt A=1 A>1 A<1
Example 6.9 Repeat Example 6.1 for absorption in a tower packed with 1.5-in. metal Pall rings. If HOG=2.0 ft, compute the required height. Solution From Example 6.1, G=180 kmol/h, L=151.5 kmol/h, yin=0.020, xin=0.0, and K=0.57. For 97% recovery of ethyl alcohol, by material balance, NTU>Nt (=6.1) due to A>1 The packing height is
Example 6.10 Experimental data have been obtained for air containing 1.6% by volume SO2 being scrubbed with pure water in a packed column of 1.5 m2 in cross-sectional area and 3.5 m in packed height. Entering gas and liquid flow rates are 0.062 and 2.2 kmol/s, respectively. If the outlet mole fraction of SO2 in the gas is 0.004 and column temperature is near ambient with KSO2=40, calculate from the data: (a) The NOG for absorption of SO2 (b) The HOG in meters (c) The volumetric overall mass transfer coefficient, Kya for SO2 in kmol/m3-s-(y). Solution (a) Assume a straight equilibrium line because the system is dilute in SO2 (b) lT=3.5m, HOG= lT/NOG=3.5/3.75=0.93 m (c) G=0.062 kmol/s, S=1.5 m2, Kya=G/HOGS=0.062/[(0.93)(1.5)]=0.044 kmol/m3-s-(y)
Example 6.11 A gaseous reactor effluent consisting of 2 mol% ethylene oxide in an inert gas is scrubbed with water at 30 C and 20 atm . The total gas feed rate is 2,500 lbmol/h, and the water rate entering the scrubber is 3,500 lbmol/h. The column, with a diameter of 4 ft, is packed in two 12-ft-high sections with 1.5-in. metal Pall rings. A liquid redistributor is located between the two packed sections. Under the operating conditions for the scrubber, the K-value for ethylene oxide is 0.85 and estimated values of kya and kxa are 200 lbmol/h-ft3-y and 165 lbmol/h-ft3-x, respectively. Calculate: (a) Kya and (b) HOG Solution
Packed Columns Efficiency, Capacity, and Pressure Drop Liquid holdup Flooding Pressure drop Gas/liquid flow rates per unit inside cross-sectional area of the column Column diameter KGa or KLa HTU Packing height Liquid Holdup ~The lowest curve corresponds to zero liquid flow, that is, the dry pressure drop. ~Over an almost 10-fold range of air velocity, the pressure drop for air flowing up through the packing is proportional to air velocity to the 1.86 power. ~As liquid flows down through the packing at an increasing rate, gas-phase pressure drop for a given gas velocity increases. ~Below a certain limiting gas velocity, the curve for each liquid velocity is a straight line parallel to the dry pressure drop curve. In this region, the liquid holdup for each liquid velocity is constant.
~For a liquid velocity of 40 m/h, specific liquid holdup is 0.08 m3/m3 of packed bed until a superficial gas velocity of 0.8 m/h is reached. ~Instead of a void fraction, , of 0.94 for the gas to flow through, the effective void fraction is reduced by the liquid holdup to 0.94-0.08=0.86, causing an increased pressure drop. ~For a given liquid velocity, the upper limit to the gas velocity for a constant liquid holdup is termed the loading point. Below this point, the gas phase is the continuous phase. ~Above this point, liquid begins to accumulate or load the bed, replacing gas holdup and causing a sharp increase in pressure drop. ~Finally, a gas velocity is reached at which the liquid surface is continuous across the top of the packing and the column is flooded. ~At the flooding point, the pressure drop increases infinitely with increasing gas velocity. ~The region between the loading point and the flooding point is the loading region; significant liquid entrainment is observed, liquid holdup increase sharply, mass transfer efficiency decrease, and column operation is unstable. ~Typically, the superficial gas velocity at the loading point is approximately 70% of that at the flooding point.
Although a packed column can operate in the loading region, most packed columns are designed to operate below the loading point, in the preloading region. The specific liquid holdup in the preloading region depends on packing characteristics, and the viscosity, density, and superficial velocity of the liquid according to the dimensionless expression L is the kinematic viscosity The ratio of specific hydraulic area of packing, ah, to specific surface area of packing, a, is given by ~Value of a and Ch are characteristic of the particular type and size of packing, as listed, together with packing void fraction, , and other packing constants in Table 6.8. ~Because the specific liquid holdup is constant in the preloading region, the above equation does not involve gas-phase properties or gas velocity.
~At low liquid velocities, liquid holdup can becomes so small that the packing is no longer completely wetted. ~When this occurs, packing efficiency decreases dramatically, particularly for aqueous systems of high surface tension. To ensure complete wetting of packing, proven liquid distributors and redistributors should be used and superficial liquid velocities should exceed the following values:
Example 6.12 An absorption column is to be designed using oil absorbent with a kinematic viscosity of three time of water at 20 C. The superficial velocity will be 0.01m/s, which is safely above the minimum value for good wetting. The superficial gas velocity will be such that operation will be in the preloading region. Two packing materials are being considered: (1) randomly packed 50-mm metal Hiflow rings and (2) metal Montz B1-200 structured packing. Estimate the specific liquid holdup for each of these two packings. Solution At 20 C for water, kinematic viscosity, =/=110-6 m2/s. Therefore, for the oil, =/=310-6 m2/s.
50-mm metal Hiflow rings Montz metal B1-200
Capacity and Pressure drop ~The column diameter is determined so as to safely avoid flooding and operate in the preloading region with a pressure drop of no greater than 1.5 in. of water head per foot of packed height (equivalent to 0.054 psi/ft of packing). ~For random packings, a nominal packing diameter not greater than one-eighth of the diameter of the column is selected; otherwise, poor distribution of liquid and vapor flow over the cross-sectional area of the column can occur, with liquid tending to migrate to the wall of the column.
Leva presented the generalized pressure drop correlation (GPDC) uo is the superficial gas velocity at flooding f is the fraction of flooding Fp=packing factor(=a/3)
Example 6.13 Air containing 5 mol% NH3 at a total flow rate of 40 lbmol/h, enters a packed column operating at 20 C and 1 atm, where 90% of the ammonia is scrubbed by a countercurrent flow of 3,000 lb/h of water. Use the GPDC chart of Figure 6.36 to estimate the superficial gas flooding velocity, the column inside diameter for operation at 70% of flooding, and the pressure drop per foot of packing for two packing materials: (a) One-inch ceramic Rasching rings (FP=179 ft2/ft3) (b) One-inch metal IMTP packing (FP=41 ft2/ft3) Solution Because the superficial gas velocity is highest at the bottom of the column, calculations are made for there. Inlet gas: MG=0.95(29)+0.05(17)=28.4 G=40 lbmol/h G=PMG/RT=(1)(28.4)/[(0.730)(293)(1.8)]=0.0738 lb/ft3 Existing liquid: Ammonia absorbed =0.90(0.05)(40)=1.8 lbmol/h Water rate=166.7 lbmol/h Mole fraction of ammonia=1.8/(166.7+1.8)=0.0107 ML=0.0107(17)+0.9893(18)=17.9 L=1.8+166.7=168.5 lbmol/h Take: L=62.4 lb/ft3 and L=1.0 cP
From Figure 6.36 g=32.2 ft/s FLG=0.092 and Y=0.702(0.125)=0.088 The pressure drop is 0.88 in. of water head per foot of packed height for both packing f=0.70 The IMTP packing has a much greater capacity than the Raschig rings, since the required column cross-sectional area is reduced by about 50%.
Theoretically based models for predicting pressure drop in packed beds with countercurrent gas/liquid flows have been by Stichlmair et al., who use a particle model, and Billet and Schultes, who use a channel model. Both models extend well-accepted equations for dry-bed pressure drop to account for the effect of liquid holdup. ~At low superficial gas velocities (modified NRe<10), typical of laminar flow, the pressure drop per unit height is proportional to the gas velocity. ~At high gas velocities, typical of turbulent flow, the pressure drop per height approaches a dependency of the square of the gas velocity. ~Most packed columns used for separation operate in the turbulent region (modified NRe>1,000). Thus, dry pressure data shown in Figure 6.34 for Bialecki rings show an exponential dependency on gas velocity of about 1.86. Similar to that flow through an empty, straight pipe. Dp is an effective packing material diameter
Billet and Schultes developed a correlation for dry-gas pressure drop, Po, similar in form to that of Figure 6.37. Their dimensionally consistent correlating equation is lT=height of packing Kw=a wall factor effective packing diameter wall factor dry-packing resistance coefficient Cp is a packing constant, determined from experimental data, and tabulated for a number of packings in Table 6.8 When the packed tower is irrigated, the liquid holdup causes the pressure drop to increase. The experimental data are reasonably well correlated by
Mass Transfer Efficiency ~The mass transfer efficiency of a packed column is incorporated in the HETP or the more theoretically based HTUs and volumetric mass transfer coefficients. ~The HETP concept lacks a sound theoretical basis, its simplicity, coupled with the relative ease with which equilibrium-stage calculations can be made with computed-aided simulation programs, has made it a widely used method for estimating packed height. ~In the preloading region and where good distribution of vapor and liquid is initiated and maintained, values of the HETP depend mainly on packing type and size, liquid viscosity, and surface tension. Kister took the following relations for rough estimates: 1.Pall rings and similar high-efficiency random packings with low-viscosity liquids: HETP, ft=1.5DP, in. 2.Structured packing at low-to-moderate pressure with low-viscosity liquids: HETP, ft=100/a, ft2/ft3+4/12 3.Absorption with viscous liquid: HETP=5 to 6 ft 4.Vacuum service: HETP, ft=1.5DP, in.+0.5 5.High-pressure service (>200 psia): HETP for structured packings may be greater than predicted by HETP, ft=100/a, ft2/ft3+4/12 6.Small-diameter columns, DT<2 ft: HETP, ft=DT, ft, but not less than 1ft
In general, lower values of HETP are achieved with smaller-size random packings, particularly in small-diameter columns, and with structured packings, particularly those with large values of a, the packing surface area per packed volume. The experimental data of Figure 6.38 for no.2 (2-in.-diameter) Nutter rings from Kunesh show that in the preloading region, the HETP is relatively independent of the vapor-flow F-factor: provided that the ratio L/G is maintained constant as the superficial gas velocity, uo, increased. Beyond the loading point, and as the flooding point is approached, the HETP can increase dramatically like the pressure drop and liquid holdup.
~Experimental mass transfer data for packed columns are usually correlated in terms of volumetric mass transfer coefficients and/or HTUs, rather than in terms of HETPs. ~The data are obtained from experiments in which either the liquid-phase or the gas-phase mass transfer resistance is negligible, so that the other resistance can be studied and correlated independently. ~For applications where both resistance may be important, the two resistances are added together according to the two-film theory of Whitman to obtain the overall resistance. ~Two film theory assumes the absence of any mass transfer resistance at the interface between the gas and liquid phases, thus, the two phases are in equilibrium at the interface.
~Instead of using mass transfer coefficient directly for column design, the transfer unit concept of Chilton and Colburn is often employed because HTUs: (1)have only one dimension (length), (2)generally vary with column conditions less than mass transfer coefficients, (3)are related to an easily understood geometrical quantity, namely, height per theoretical stage. ~Figure 6.39 show the data for three different size Berl-saddle packings for the stripping of oxygen from water by air, in a 20-in.-I.D. column operated at near-ambient temperature and pressure in the preloading region. ~The effect of liquid velocity on kLa is seen to be quite pronounced, with kLa increasing at about the 0.75 power of the liquid mass velocity. ~Gas velocity was to have no effect on kLa in the preloading region. ~HL does not depend as strongly as kLa on liquid velocity.
Figure 6.40 shows the data on the effect of liquid velocity on kLa in the preloading region for two different size ceramic Hiflow ring packings using the system of CO2-air-H2O. Figure 6.41 shows the data on the effect of the F-factor on kLa at a constant liquid flow rate with 50-mm plastic Pall rings and Hiflow rings using the system of CO2- air-H2O. ~Up to an F-factor value of about of 1.8 m-1/2-s-1-kg1/2, which is in the preloading region, no effect gas velocity is observed. ~Above the loading limit, kLa increases with increasing gas velocity because of increased liquid holdup, which increase interfacial surface area for mass transfer. n=0.6~0.95, 0.75 typical value The exponent on the diffusivity is consistent with the penetration theory.
~Figures 6.42 and 6.43 show the data for two different plastic packings using the system of NH3-air-H2O. ~The kGa vlauesare proportional to about the 0.75 power of F. ~The liquid velocity also affects the kGa values, probably because as the liquid rate is increased, the holdup increases and more interfacial surface is created. DG=gas diffusivity m’=0.65~0.85, 0.8 typical value n’=0.25~0.5
~The development of correlations for mass transfer from experimental data is difficult because, as shown by Billet in a comprehensive study with metal Pall rings, values of the mass transfer coefficients are significantly affected by the technique used to pack the column and the number of liquid feed distribution points per unit of column cross section, when this number is less than 10 points/ft2. ~When 25 points/ft2 are used and DT/Dp>10, column diameter has little, if any, effect on mass transfer coefficients for packed height up to 20 ft.
Billet and Schultes assume (1)uniform distribution of gas and liquid over the cross-sectional area of the column and apply the two-film theory of mass transfer. (2)for the liquid-phase resistance, the liquid flows in a thin film through the irregular channels of the packing, with continual remixing of the liquid at points of contact with the packing such that penetration theory can applied. penetration theory time of exposure of the liquid film before remixing
Example 6.14 For the absorption of ethyl alcohol form CO2 with water, as considered in Example 6.1, a 2.5-ft-I.D. tower, packed with 1.5-in. metal Pall-like Rings, is to be used. It is estimated that the tower will operate in the preloading region with a pressure drop of approximately 1.5 in. of water head per foot of packed height. From example 6.9, the required number of overall transfer units based on the gas phase is 7.5. Estimate HG, HL, HOG, HETP, and the required packed height in feet using the following estimates of flow conditions and physical properties at the bottom of the packing:
Solution Cross-sectional area of tower = (3.14)(2.5)2/4 = 4.91 ft2. Volumetric liquid flow rate = 6,140/61.5 = 99.8 ft3/h. uL = superficial liquid velocity = 99.8/[(4.91)(3,600)] = 0.0056 ft/s = 0.0017 m/s uo = superficial gas velocity = 17,480/[(0.121)(4.91)(3,600)] = 8.17 ft/s = 2.49 m/s Packing characteristic for the 1.5-inch metal Pall-like rings a=149.6 m2/m3=0.952 Ch=approximately 0.7 CL=1.227 CV=0.341 Estimation of specific liquid holdup, hL:
Estimation of HL: Estimation of HG:
Estimation of HOG: Estimation of Packed Height: Estimation of HETP: