Download
1 / 9
90 likes | 183 Vues
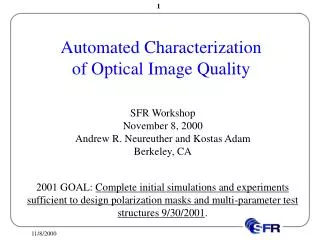
Automated Characterization of Optical Image Quality. SFR Workshop November 8, 2000 Andrew R. Neureuther and Kostas Adam Berkeley, CA. 2001 GOAL: Complete initial simulations and experiments sufficient to design polarization masks and multi-parameter test structures 9/30/2001.

E N D
Automated Characterization of Optical Image Quality SFR Workshop November 8, 2000 Andrew R. Neureuther and Kostas Adam Berkeley, CA 2001 GOAL: Complete initial simulations and experiments sufficient to design polarization masks and multi-parameter test structures 9/30/2001.
Motivation: Multi-Parameter Test Structures Combine automated (optical and/or SEM) wafer inspection with simulation interpretation of results. • Simulation design of test mask artifacts and characterization procedures • 3-5X enhanced sensitivity with 2-3 x reduced confounding • Half-Tone phase edges, phase dots, adjacent defects • Focus/dose behavior, PEB time, Resist A/B, additive partial clear field exposures, etc. • Inspection: • Presence or absence of resist remaining, linewidth, bridging • Assign causes through statistical analysis
0.4 l/NA 180o Sq. Defect 0.6 l/NA Line Defect-Probe Based Aberration Targets: Concept 0.5 l/NA The 0.4 l/NA by 0.4 l/NA programmed 180o phase defect provides an interferometric like reference electric field with magnitude 0.43 and phase of 180o compared to the clear area field. Sidelobe Coma Sidelobe -0.1 wave => 0.40 0.0 wave => 0.30 0.1 wave => 0.21 Detect Sidelobe by over exposing 2.5x and using automatic wafer inspection
Defect-Probe Based Aberration Targets: Design Example for coma 1) Characterize the Point Spread Electric Field Pin Hole PS Electric Field 2) Inverse Map PSEF to locate target components Defect Probe Target Components 3) Add target components to reduce confounding Added Components that reduce Astigmatism and Spherical Aberration 1 at 0o 1 at 180o
Defect-Probe Based Aberration Targets: Layout Dark Field Patterns Grid is 0.1 l/NA Probe Astigmatism Spherical 1 at 90o Trefoil Coma 1 at 0o 1 at 180o
0.181 0.366 0.190 0.068 Astig (cos) - Trefoil No Aberration + Trefoil - Coma (cos) Defect-Probe Based Aberration Targets: Trefoil Sensitivity Orthogonality 0. 182 0.167 Defocus 0.192
Defect-Probe Based Aberration Targets: Spherical Sensitivity 0.044 0.191 0.391 - Spherical No aberration + Spherical Orthogonality 0.010 0.569 High sensitivity to spherical but poor orthogonality to defocus. - Defocus + Defocus
Defect-Based Aberration Target: Data Summary Individual Zernike’s Set of Zernike’s < 0.01 Trefoil ~ 0.1l Astig
Polarization orthogonal spillover Polarization adjusted half-tone Phase-shifted spillover Reduced Proximity Half-Tone Phase Shift 2002 and 2003 Goals Conduct and quantitatively interpret polarization masks, and multi-parameter test structures, by 9/30/2002. Define apparatus, specify testing procedures, and interpret data for polarization masks, and multi-parameter test structures, by 9/30/2003. Polarization Masks Masks to be made by nanoimprint lithography with UTA.