Download
1 / 19
210 likes | 385 Vues
Optical alignment and image quality testing at GSFC. Test lead: Bill Eichorn, GSFC Test conductors: George Hartig, Sylvia Baggett, Massimo Stiavelli

E N D
Optical alignment and image quality testing at GSFC • Test lead: Bill Eichorn, GSFC Test conductors: George Hartig, Sylvia Baggett, Massimo Stiavelli • Full suite of alignment and image quality tests performed twice: before and after vibe test. 1st epoch : 21 Mar-18 Apr ’03, 2nd epoch ongoing • WFC3 with non-flight detectors (IR MUX, UVIS surrogate) and flight POM installed in RIAF with OS (CASTLE) providing OTA-like point source illumination at 633 nm (only) • During 2nd epoch flat fields in F336W, F439W, and F625W were also obtained • Over ~4000 images obtained on both IR and UVIS channels
Optical alignment and image quality testing at GSFC • Test objectives: • Demonstrate Optical Stimulus (CASTLE) performance over field; develop techniques and procedures • Obtain pre-vibration (of OA) alignment baseline and compare it with post-vibration data • Compare with results obtained at Ball with Mini-Stimulus • Measure residual surrogate detector alignment offsets for use in flight detector alignment • Assess image quality and wavefront performance of the completed optical assembly
Optical Stimulus (CASTLE) Rm 150 Bld 29 Clean room
CASTLE Schematic M 4 S t e e r i n g M i r r o r P r e c i s i o n E n c M 1 S t i m u l u s R e l a y O p t i c s M 2 U p p e r R e t i c l e T a r g e t P l a n e P o i n t S o u r c e s W F C 3 P O M R I A F O T A L a t c h P l a n e A B C L a t c h e s L o w e r R e t i c l e O T A S t a 1 9 8 . 4 4 0 M 3 S t e e r i n g M i r r o r o d e r s P r e c i s i o n E n c o d e r s • Images positioned over field with 2 gimballed flats - produces pupil rotation • Inverted Cassegrain with 46% Central Obscuration S w i t c h i n g M i r r o r I n t e g r a t i n g S l i d e s i n p l a n e f o r S p h e r e E x t e n d e d S o u r c e s • Point source XYZ stage permits accurate focus adjustment F i b e r F e e d A l i g n m e n t F l u x M o n i t o r s M o n i t o r
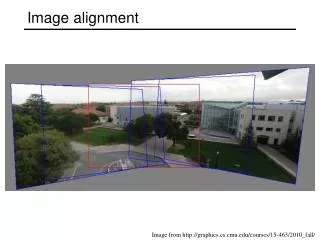
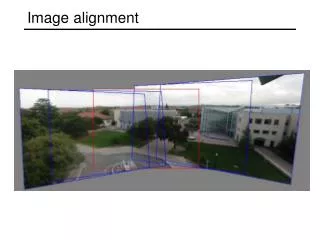
CASTLE Test Image Field Locations • Measurements made at 16-17 points, uniformly-distributed over IR and UVIS fields (4-5 used at Ball)
Phase Retrieval • Phase retrieval (PR) analysis measures low-order aberration content of the system at the detector, including focus • Sets of monochromatic images obtained at multiple focus settings, on both sides of best focus, and fit simultaneously to remove ambiguity • IDL PR routines developed by Burrows & Krist (ca 1990), used for COSTAR, STIS, NICMOS, and ACS optical verification and alignment, and adapted for WFC3 • Only 13 lowest-order terms in Zernike expansion used for wavefront fit; generally provides good indicator of alignment state and final optical performance
IR Channel Alignment Phase Retrieval Pupil/WFE map (cold mask) Measured MUX image Modeled (fit) image Weighted difference image
UVIS Channel Alignment Phase Retrieval Pupil/WFE map (OS obsc/spiders) Measured MUX image Modeled (fit) image Weighted difference image
Optical alignment summary • Phase retrieval and focus scan (CASTLE fiber or WFC3 corrector) techniques yield similar, repeatable results • Residual detector tip/tilt after alignment at Ball corroborated with CASTLE measurements using alternative focal surface alignment technique • Alignment of both detectors should be improved with shim offsets as flight detectors are aligned in transfer fixture at Ball • UVIS detector roll off nominal by 0.8 degrees, position off by ~50 pixels • Set incorrectly at Ball, will be compensated for flight detectors • IR detector roll nearly perfect (<0.1 degrees from nominal) • IR focus is essentially identical to measurement at Ball • UVIS focus differs by ~0.5 mm (STOPT) from Ball measurement • Believed to be due to offset in model positions for Mini-stimulus • Vibration testing did not alter alignment or image quality apart from a small shift – identical in both channel – probably due to latches tolerance
UVIS Encircled Energy Measurements vs. Model • CASTLE EE measurements require correction for 0.46 central obscuration ratio (OTA is 0.33), spider width and other differences from OTA, as well as limited measurement radius, to predict on-orbit EE performance. • CEI Spec: EE(.25 arcsec diam.) > 0.75 (goal 0.80) at 633 nm • EE spec will readily met, goal will likely be achieved on-orbit, if flight detector performance and alignment are as expected.
Flat Field Analysis C-D amp
Flat Field Analysis • Many negative pupil images seen in the flat fields. They do not depend on the filter and have sizes compatible with what would be espected from dust particles on the surrogate UVIS detector. • Vignetting has been found on one corner of the field of view. It is a triangular area about 400 pixels long and 30 pixels wide at the largest point. Over this area the flux rolls down by more than a factor 2. • Not caused by filters, pickoff or channel select mechanism: too sharp (pickoff) and unaffected by rotating filters/CSM to off-nominal positions • It may be caused either by baffles close to the detector or by the camera head itself (currently at an incorrect position)
Flat Field Analysis A-B Amp
Conclusions • The various sets of measurements are consistent • The data will allow us to position the flight detectors at the correct position • Vibration testing did not significantly alter alignment or image quality • Small amount of vignetting in UVIS channel (still to be investigated) • EE field center goal on UVIS should be met over the whole field