Download
1 / 9
90 likes | 171 Vues
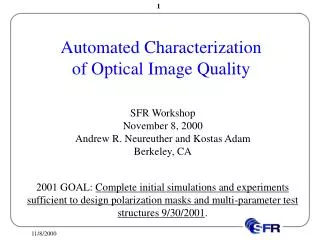
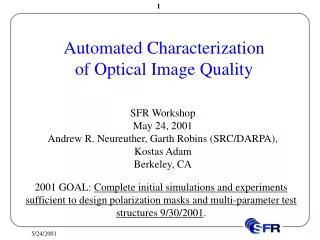
Automated Characterization of Optical Image Quality. SFR Workshop May 24, 2001 Andrew R. Neureuther, Garth Robins (SRC/DARPA), Kostas Adam Berkeley, CA.

E N D
Automated Characterization of Optical Image Quality SFR Workshop May 24, 2001 Andrew R. Neureuther, Garth Robins (SRC/DARPA), Kostas Adam Berkeley, CA 2001 GOAL: Complete initial simulations and experiments sufficient to design polarization masks and multi-parameter test structures 9/30/2001.
Motivation • Lithography at low k1, high NA and with phase-shifting masks is adversely affected by small residual aberrations in lenses. • Test targets are needed: • As ‘canaries’ that are more sensitive than product features • To quantify individual aberrations to 0.01 waves rms • The introduction of polarizing features allows an as yet an untapped degree of freedom for lithography. • A combination of theoretical image analysis, simulation and experimentation can be used to gain insight and understanding to assure small feature reproducibility. • Combining automatic (optical and/or SEM) wafer inspection with simulation interpretation gives leverage.
Programmed-Probe Based Aberration Targets: Concept 0.5 l/NA The 0.4 l/NA by 0.4 l/NA programmed 180o phase defect provides an interferometric like reference electric field with magnitude 0.43 and phase of 180o compared to the clear area field. 0.4 l/NA 180o Sq. Defect 0.6 l/NA Line Sidelobe Coma Sidelobe -0.1 wave => 0.40 0.0 wave => 0.30 0.1 wave => 0.21 Detect Sidelobe by over exposing 2.5x and using automatic wafer inspection
Programmed-Probe Based Aberration Targets: Layout Dark Field Patterns Grid is 0.1 l/NA Probe Astigmatism Spherical 1 at 90o Trefoil Coma 1 at 0o 1 at 180o
Evolution of the Program-Probe Targets Improvement
First Demonstration of Separation of Spherical and Defocus 90 0 180
NEW Theoretical Foundation for PPBAT • Approach • Represent target diffraction as sum of Zernike’s in pupil • Approx. exp[jOPD] as 1 + jOPD • Result • Orthogonality allows each aberration to be excited alone • Target is the Fourier Transform of that particular Zernike • Implications • Diameter of target goes inversely with radial order • Phase variation on target is similar to Airy function • The center is a natural location for the probe because the weighted area of Zernike is zero and gives a null in the center.
Tolerance Assessment of PPBAT • Mask Dimensions • Probe size – High 10% –Calibrate via isolated probe=> 1% • Feature Linewidth –Low – 0.8% • Alignment • Probe to feature – High 4% or with raster scan Low 1% • Phase to feature – Moderate 1.5% • Phase Process • Phase – Low 0.25% • Etch Bias – Moderate 1.5% – Fix: use flavors => 0.5% • Profile shape – Low 1% (can be checked with TEMPEST) • Ga stain – Low 0.1% Use to monitor mask quality? RSS Combined ~ 4.8% => 2.5%
2002 and 2003 Goals Aberration Targets Measure with CD SEM Electrical Test Measure with Electroglass Haolin Zhang and Costas Spanos Conduct and quantitatively interpret polarization masks, and multi-parameter test structures, by 9/30/2002. Define apparatus, specify testing procedures, and interpret data for polarization masks, and multi-parameter test structures, by 9/30/2003.