Download

1 / 60
600 likes | 735 Vues
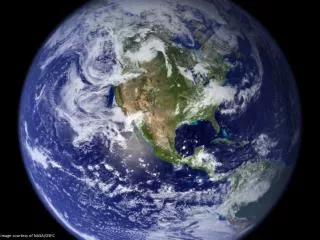
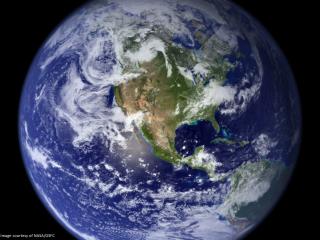
Image courtesy of NASA/GSFC. Climate Change in the Heartland. Eugene S. Takle Director, Climate Science Program Professor of Atmospheric Science Department of Geological and Atmospheric Sciences Professor of Agricultural Meteorology Department of Agronomy Iowa State University

E N D
Climate Change in the Heartland Eugene S. Takle Director, Climate Science Program Professor of Atmospheric Science Department of Geological and Atmospheric Sciences Professor of Agricultural Meteorology Department of Agronomy Iowa State University Ames, Iowa 50011 gstakle@iastate.edu Heartland Regional Roundtable Nutrient Management for Water Protection in Highly Productive Systems of the Heartland Lied Center, Nebraska City June 8-10, 2010
Outline • Observed global changes in carbon dioxide and temperature • Projected future changes in global and US temperatures and precipitation • Future climate change for Iowa and the US Midwest
Karl, T. R., J. M. Melillo, and T. C. Peterson, (eds.), 2009: Global Climate Change Impacts in the United States. Cambridge University Press, 2009, 196pp.
Global Carbon Emissions (Gt) Actual emissions are exceeding worst case scenarios projected in 1990
Forcing Factors in the Global Climate Karl, T. R., J. M. Melillo, and T. C. Peterson, (eds.), 2009: Global Climate Change Impacts in the United States. Cambridge University Press, 2009, 196pp.
Increasing greenhouse gases increases heating of the Earth Increased Greenhouse Gases => Global Heating
Warming of the Lower and Upper Atmosphere Produced by Natural and Human Causes Note that greenhouse gases have a unique temperature signature, with strong warming in the upper troposphere, cooling in the lower stratosphere and strong warming over the North Pole. No other warming factors have this signature. Karl, T. R., J. M. Melillo, and T. C. Peterson, (eds.), 2009: Global Climate Change Impacts in the United States. Cambridge University Press, 2009, 196pp.
Global Mean Surface Temperature http://www.ncdc.noaa.gov/img/climate/research/2008/ann/global-jan-dec-error-bar-pg.gif
Global Mean Surface Temperature I II III IV http://www.ncdc.noaa.gov/img/climate/research/2008/ann/global-jan-dec-error-bar-pg.gif
Energy intensive Balanced fuel sources More environmentally friendly If current emission trends continue, global temperature rise will exceed worst case scenarios projected in 2007 FI =fossil intensive IPCC Fourth Assessment Report Summary for Policy Makers
Karl, T. R., J. M. Melillo, and T. C. Peterson, (eds.), 2009: Global Climate Change Impacts in the United States. Cambridge University Press, 2009, 196pp.
Karl, T. R., J. M. Melillo, and T. C. Peterson, (eds.), 2009: Global Climate Change Impacts in the United States. Cambridge University Press, 2009, 196pp.
Karl, T. R., J. M. Melillo, and T. C. Peterson, (eds.), 2009: Global Climate Change Impacts in the United States. Cambridge University Press, 2009, 196pp.
“One of the clearest trends in the United States observational record is an increasing frequency and intensity of heavy precipitation events… Over the last century there was a 50% increase in the frequency of days with precipitation over 101.6 mm (four inches) in the upper midwestern U.S.; this trend is statistically significant “ Karl, T. R., J. M. Melillo, and T. C. Peterson, (eds.), 2009: Global Climate Change Impacts in the United States. Cambridge University Press, 2009, 196pp.
Trend of increase in occurrence of heavy precipitation over the 20th C is consistent with increasing GHG concentrations. Frequency of intense precipitation events is likely to increase in the future. Karl, T. R., J. M. Melillo, and T. C. Peterson, (eds.), 2009: Global Climate Change Impacts in the United States. Cambridge University Press, 2009, 196pp.
Adaptation Necessary Adaptation Necessary Mitigation Possible Karl, T. R., J. M. Melillo, and T. C. Peterson, (eds.), 2009: Global Climate Change Impacts in the United States. Cambridge University Press, 2009, 196pp.
Adaptation Necessary Farmers install more drainage tile Adaptation Necessary Mitigation Possible Karl, T. R., J. M. Melillo, and T. C. Peterson, (eds.), 2009: Global Climate Change Impacts in the United States. Cambridge University Press, 2009, 196pp.
The planet is committed to a warming over the next 50 years regardless of political decisions Adaptation Necessary Adaptation Necessary Mitigation Possible Karl, T. R., J. M. Melillo, and T. C. Peterson, (eds.), 2009: Global Climate Change Impacts in the United States. Cambridge University Press, 2009, 196pp.
The planet is committed to a warming over the next 50 years regardless of political decisions Adaptation Necessary Farmers plant earlier, choose longer season hybrids Adaptation Necessary Mitigation Possible Karl, T. R., J. M. Melillo, and T. C. Peterson, (eds.), 2009: Global Climate Change Impacts in the United States. Cambridge University Press, 2009, 196pp.
Decline in Greenland Ice Mass Equivalent to about 5 ft of ice over the state of Iowa each year
Karl, T. R., J. M. Melillo, and T. C. Peterson, (eds.), 2009: Global Climate Change Impacts in the United States. Cambridge University Press, 2009, 196pp.
Insured Losses from Weather-Related Catastrophes 1980-2005 Karl, T. R., J. M. Melillo, and T. C. Peterson, (eds.), 2009: Global Climate Change Impacts in the United States. Cambridge University Press, 2009, 196pp.
Temperature rises in regions having thunderstorms likely to experience increased occurrence of lightning Karl, T. R., J. M. Melillo, and T. C. Peterson, (eds.), 2009: Global Climate Change Impacts in the United States. Cambridge University Press, 2009, 196pp.
Karl, T. R., J. M. Melillo, and T. C. Peterson, (eds.), 2009: Global Climate Change Impacts in the United States. Cambridge University Press, 2009, 196pp.
Findings of the US National Assessment • Global warming is unequivocal and primarily human-induced • Climate changes are underway in the United States and are projected to grow • Widespread climate-related impacts are occurring now and are expected to increase • Climate change will stress water resources • Crop and livestock production will be increasingly challenged • Coastal areas are at increasing risk from sea-level rise and storm surge • Risks to human health will increase • Climate change will interact with many social and environmental stresses • Thresholds will be crossed, leading to large changes in climate and ecosystems • Future climate change and its impacts depend on choices made today
Observed Summer (JJA) Daily Maximum Temperature Changes (K), 1976-2000 Adapted from Folland et al. [2001]
Des Moines Airport Data 1983: 13 1988: 10 2009: 0
Des Moines Airport Data 1983: 13 1988: 10 6 days ≥ 100oF in the last 20 years 2009: 0
State-Wide Average Data 37.5” 31.5” 19% increase
State-Wide Average Data Totals above 40”
State-Wide Average Data Totals above 40” 8 years 2 years
Cedar Rapids Data 28.0” 32% increase 37.0”
Cedar Rapids Data 51% increase 11.8” 7.8”
Cedar Rapids Data 34% increase 20.2” 26.8”
“One of the clearest trends in the United States observational record is an increasing frequency and intensity of heavy precipitation events… Over the last century there was a 50% increase in the frequency of days with precipitation over 101.6 mm (four inches) in the upper midwestern U.S.; this trend is statistically significant “ Karl, T. R., J. M. Melillo, and T. C. Peterson, (eds.), 2009: Global Climate Change Impacts in the United States. Cambridge University Press, 2009, 196pp.
Cedar Rapids Data 57% increase 6.6 days 4.2 days
Cedar Rapids Data Years having more than 8 days 11 2 57% increase 6.6 days 4.2 days
SWAT (RegCM2): 21 % increase in precip -> 50% increase in streamflow Relationship of Streamflow to Precipitation in Current and Future Climates DrainMod (RegCM2): 24 % increase in precip -> 35% increase in tile drainage DrainMod (HIRHAM): 32 % increase in precip -> 80% increase in tile drainage
13% increase es = 17.65 mb es = 19.99 mb D. Herzmann, Iowa Environmental Mesonet