Download

1 / 67
670 likes | 796 Vues
Understand global climate change, regional impacts, and the science behind it. Learn about human-induced factors, greenhouse gases, and historical variations to make informed decisions. Explore temperature trends, carbon emissions, and evidence of human influence on climate change.

E N D
Climate Change: Educating for Informed Decision-Making Eugene S. Takle Professor of Atmospheric Science Professor of Agricultural Meteorology Director, Climate Science Program Iowa State University Ames, IA 50011 gstakle@iastate.edu Iowa Association of Community College Trustees Annual Conference Iowa Valley Community College District Marshalltown, IA 29 July 2010
Outline • The science of global climate change • Climate change in Iowa • Using local/regional climate change as a springboard to understanding global climate change and the nature of science
Global climate change is one of the most important issues facing humanity The scientific evidence clearly indicates that our climate is changing, and that human activities have been identified as a dominant contributing cause. Don Wuebbles
Climate changes are underway in the U.S. and are projected to grow Temperature rise Sea-level rise Increase in heavy downpours Rapidly retreating glaciers Thawing permafrost Lengthening growingseason Lengthening ice-free seasonin the ocean and on lakesand rivers Earlier snowmelt Changes in river flows Plants blooming earlier; animals, birds and fish moving northward Don Wuebbles
Three separate analyses of the temperature record – Trends are in close agreement Don Wuebbles
Three separate analyses of the temperature record – Trends are in close agreement January-June 2010 is the warmest such Jan-June in the 160 year record Don Wuebbles
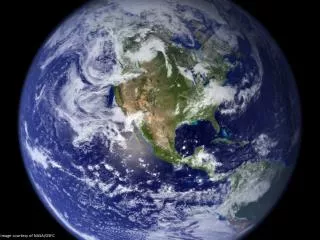
Temperature Changes are Not Uniform Around the Globe From Tom Karl, NOAA NCDC
U.S. Temperature Trends U.S. average temperature has risen more than 2oF over the past 50 years From Tom Karl, NOAA NCDC
Conditions today are unusual in the context of the last 2,000 years … Don Wuebbles
Why does the Earth warm?1. Natural causes THE GREENHOUSE EFFECT… • …is 100% natural. • Heat is trapped in the atmosphere. • …sustains life on Earth. • Keeps average temperatures at 12.8oC (55oF), instead of –29oC (-20oF). Don Wuebbles
Why does the Earth warm?2. Human causes THE ENHANCED GREENHOUSE EFFECT (or GLOBAL WARMING) • … is primarily human-induced: We’re increasing heat-trapping gases in the atmosphere. • … is like wrapping an extra blanket around the Earth. Don Wuebbles
Natural factors affect climate Variations in the energy received from the sun Variations in the Earth's orbit (Milankovic effect) Stratospheric aerosols from energetic volcanic eruptions Chaotic interactions in the Earth's climate (for example, El Nino, NAO) Don Wuebbles
Non-natural mechanisms • Changes in atmospheric concentrations ofradiatively important gases • Changes in aerosol particles from burning fossil fuels and biomass • Changes in the reflectivity (albedo) of the Earth’s surface Don Wuebbles
We have Moved Outside the Range of Historical Variation 800,000 Year Record of Carbon Dioxide Concentration Don Wuebbles
Annual Global Carbon Emissions (Gt) Actual emissions are exceeding worst case scenarios projected in 1990
Warming of the Lower and Upper Atmosphere Produced by Natural and Human Causes Karl, T. R., J. M. Melillo, and T. C. Peterson, (eds.), 2009: Global Climate Change Impacts in the United States. Cambridge University Press, 2009, 196pp.
Warming of the Lower and Upper Atmosphere Produced by Natural and Human Causes Note that greenhouse gases have a unique temperature signature, with strong warming in the upper troposphere, cooling in the lower stratosphere and strong warming over the North Pole. No other warming factors have this signature. Karl, T. R., J. M. Melillo, and T. C. Peterson, (eds.), 2009: Global Climate Change Impacts in the United States. Cambridge University Press, 2009, 196pp.
Warming of the Lower and Upper Atmosphere Produced by Natural and Human Causes Note that greenhouse gases have a unique temperature signature, with strong warming in the upper troposphere, cooling in the lower stratosphere and strong warming over the North Pole. No other warming factors have this signature. Karl, T. R., J. M. Melillo, and T. C. Peterson, (eds.), 2009: Global Climate Change Impacts in the United States. Cambridge University Press, 2009, 196pp.
Many lines of evidence for conclusion of a “discernible human influence” • “Basic physics” evidence • Physical understanding of the climate system and the heat-trapping properties of greenhouse gases • Qualitative analysis evidence • Qualitative agreement between observed climate changes and model predictions of human-caused climate changes (warming of oceans, land surface and troposphere, water vapor increases, etc.) • Paleoclimate evidence • Reconstructions of past climates enable us to place the warming of the 20th century in a longer-term context • Fingerprint evidence • Rigorous statistical comparisons between modeled and observed patterns of climate change Don Wuebbles
Climate models: Natural processes do not account for observed 20th century warming after 1965 Don Wuebbles
Energy intensive Balanced fuel sources More environmentally friendly If current emission trends continue, global temperature rise will exceed worst case scenarios projected in 2007 FI =fossil intensive IPCC Fourth Assessment Report Summary for Policy Makers
What can we expect in the future? Don Wuebbles
December-January-February Temperature Change 7.2oF 6.3oF A1B Emission Scenario 2080-2099 minus1980-1999
June-July-August Temperature Change 4.5oF 5.4oF A1B Emission Scenario 2080-2099 minus1980-1999
June-July-August Temperature Change 4.5oF 5.4oF A1B Emission Scenario 2080-2099 minus1980-1999 Not the direction of current trends
Des Moines Airport Data 1983: 13 1988: 10 1977: 8 2009: 0
Des Moines Airport Data 1983: 13 1988: 10 6 days ≥ 100oF in the last 20 years 1977: 8 2009: 0
Increases in very high temperatures will have wide-ranging effects Higher Emissions Scenario, 2080-2099 Number of Days Over 100ºF Average: 30-40 days Recent Past, 1961-1979 Lower Emissions Scenario, 2080-2099 Average: 10-20 days Don Wuebbles
Low confidence in model projection of summer precipitation IPCC 2007
2080-2099 Karl, T. R., J. M. Melillo, and T. C. Peterson, (eds.), 2009: Global Climate Change Impacts in the United States. Cambridge University Press, 2009, 196pp.
2080-2099 Low confidence Karl, T. R., J. M. Melillo, and T. C. Peterson, (eds.), 2009: Global Climate Change Impacts in the United States. Cambridge University Press, 2009, 196pp.
Extreme weather events become more common • Events now considered rare will become commonplace. • Heat waves will likely become longer and more severe • Droughts are likely to become more frequent and severe in some regions • Likely increase in severe thunderstorms (and perhaps in tornadoes). • Winter storm tracks are shifting northward and the strongest storms are likely to become stronger and more frequent. Don Wuebbles
1 meter will be hard to avoid, possibly within this century, just from thermal expansion and small glacier melt. Don Wuebbles
Widespread climate-related impacts are occurring now and are expected to increase Water Resources Energy Supply & Use Transportation Agriculture Ecosystems Human Health Society Don Wuebbles
Iowa State-Wide Average Data 34.0” 8% increase 31.5”
Iowa State-Wide Average Data Totals above 40” 2 years
Iowa State-Wide Average Data Totals above 40” 8 years 2 years
Cedar Rapids Data 32% increase 28.0” 37.0”
Cedar Rapids Data 51% increase 11.8” 7.8”
Cedar Rapids Data 34% increase 26.8” 20.2”