Key Issues
Challenges in Process Comparison Studies Seth Clark, Merck and Co., Inc. Acknowledgements: Robert Capen, Dave Christopher, Phil Bennett, Robert Hards, Xiaoyu Chen, Edith Senderak, Randy Henrickson . Key Issues.

Key Issues
E N D
Presentation Transcript
Challenges in Process Comparison StudiesSeth Clark, Merck and Co., Inc.Acknowledgements: Robert Capen, Dave Christopher, Phil Bennett, Robert Hards, Xiaoyu Chen, Edith Senderak, Randy Henrickson
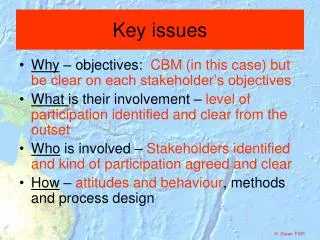
Key Issues • There are different challenges for biologics versus small molecules in process comparison studies • Biologic problem is often poorly defined • Strategies for addressing risks associated with process variability early in product life cycle with limited experience
Biologic Process Comparison Problem • Biological products such as monoclonal antibodies have complex bioprocesses to derive, purify, and formulate the “drug substance” (DS) and “drug product” (DP) • The process definition established for Phase I clinical supplies may have to be changed for Phase III supplies (for example). • Scale up change: 500L fermenter to 5000L fermenter • Change manufacturing site • Remove additional impurity for marketing advantage • Change resin manufacturer to more reliable source Buffers Resins Cells Fermentation Separation & Purification Buffers Medium DS DP Filtration Formulation
Comparison Exercise ICH Q5E: The goal of the comparability exercise is to ensure the quality, safety and efficacy of drug product produced by a changed manufacturing process, through collection and evaluation of the relevant data to determine whether there might be any adverse impact on the drug product due to the manufacturing process changes Scientific justification for analytical only comparison N Y Meaningful change in CQAs or important analytical QAs Comparison decision N Comparable Y Meaningful change in preclinical animal and/or clinical S/E N Not Comparable Y
What about QbD? X space Critical process parms., Material Attrb. Y space Critical Quality Attributes Knowledge Space Models Acceptable Quality Constraint Region that links to Safety, efficacy, etc. DS Complete? Models? S/E = f(CQAs) + e = f(g(CPP)) + e QbD relates process parameters (CPPs) to CQAs which drive S/E in the clinic Zspace Clinical Safety/Efficacy (S/E) Acceptable Clincial S/E
Risks and Appropriate Test Truth • Hypotheses of an equivalence type of test • Process mean and variance both important • Study design and “sample size” need to be addressed • Meaningful differences are often not clear • Difficulty defining meaningful differences & need to demonstrate “highly similar” imply statistically meaningful differences may also warrant further evaluation • Non-comparability can result from “improvement” Conclusion H0: Not Comparable Analytically Action: Examine with scientific judgment, determine if preclinical/clinical studies needed to determine comparability Ha: Comparable Analytically Action: Support scientific argument with evidence for Comparable CQAs
Specification Setting USL URL f(CQAs) = S/E ?? Clinical Safety/Efficacy (S/E) ~ CQA LRL LSL • In many cases for biologics an explicitf linking CQA to S/E is unknown • usually is an qualitative link between CQA and S/E • Difficult to establish such an f for biologics • Specs correspond to this link and are refined & supported with clinical experience and data on process capability and stability
Process and Spec Life Cycle Time Commercial Preclinical Phase I Phase III USL Process 1 Process 3 Process 2 Process Development Process 3 Process 4 CQA Release Design Space in Effect 1 2 3 4 LSL Preliminary specs and process 1 identified Upper spec revised based on clinical S Process revised to lower mean Process revised again but is not tested in clinic (analytical comparison only) Process 3 in commercial production with further post approval changes 1 Commercial Preclinical/Animal data 2 Phase III Study Phase I Study 3 Clinical Trial Data 4
Sample Size Problem • “Wide format” • Unbalanced (N old process > N new process) • Process variation, N = # lots • Usually more of a concern • Independence of lots • What drives # lots available? • Needs for clinical program • Time, resources, funding available • Rules of thumb • Minimum 3 lots/process for release • 3 lots/process or fewer stability • 1-2 for forced degradation (2 previous vs 1 new) • DF for estimating assay variation • Usually less of a concern • Have multiple stability testing results • Have assay qualification/validation data sets
More about # of Lots Same source DS lot! • “Three consecutive successful batches has become the de facto industry practice, although this number is not specified in the FDA guidance documents” Schneider et. al. (2006) “…batches are not independent. This could be the case if the manufacturer does not shut down, clean out, and restart the manufacturing process from scratch for each of the validation batches.” Peterson (2008)
Stability Concerns Long term Stability Forced Degradation Evaluate differences in slope between processes Evaluate differences in derivative curve • Constrained intercept multiple temperature model gives more precise lot release means and good estimates of assay + sample variation • Similar sample size problems • Generally don’t test for differences in lot variation given limited # lots CQA/ week Blue process shows improvement in rate Not comparable Y = ( + Lot ) + (1 + LotTemp + Temp)*f(Months) + eTest + eResidual
Methods and Practicalities • Methods used • Comparable to data range • Conforms to control-limit • Tolerance limits • 3 sigma limits • multivariate process control • Difference test • Equivalence test • Not practical • Process variance comparison • Large # lots late in development, prior to commercial
Methods and Practicalities Symbols are N historical lots Comparisons to N2=3 new lots LSL = -1 Mean=0 USL = 1 Delta = 0.25 Assay var = 2*lot var Total SD = 0.19 Alpha = Pr(test concludes analytically comparable when not) = Pr(consumer risk) Beta = Pr(test concludes not analytically comparable when is) = Pr(producer risk)
Defining a Risk Based Meaningful Difference 3 2 RSD 2 1 3 1 CpuC Boundary CpkC Boundary 0 0 Starting process Change not meaningful 1 LRL = Lower release limit URL = Upper release limit = process mean = process variance Change meaningful 2 Risk level of meaningful differences are fine tuned through Cpk or Cpu Key quality characteristic Change borderline meaningful 3
Defining a Risk Based Meaningful Difference 2 RSD 2 1 1 CpuC Boundary CpkC Boundary 0 0 Starting process Underlying Assumption that we are starting with a process that already has acceptable risk Meaningful change 1 Meaningful change? 2
Two-sided meaningful change • Simplifying Assumptions • Process 1 is in control with good capability (true Cpk>C) with respect to meaningful change window, (L,U) • Process 1 is approx. centered in meaningful change window • Process distributions are normally distributed with same process variance, 2 • Equivalence Test on process distribution mean difference H0: Risk based in terms of Cpk: HA: The power of this test at for unbalanced gives the sample size calculation: Sample size driven by type I and II risks and , the process risk rel. to max risk
Two-sided meaningful change sample sizes Historical New A comparison of 3 batches to 3 batches requires a 3 sigma effect size A 2 sigma effect size requires a 13 batch historical database to compare to 3 new batches A 1 sigma effect size requires 70 batch historical database to compare to 10 new batches (not shown) Effect size = process capability in #sigmasvs max tolerable capability in #sigmas
One-sided (upper) meaningful change • Similar simplifying assumptions as with two-sided evaluation • Meaningful change window is now (0,U) • Test on process distribution mean difference Risk based in terms of Cpk: H0: Linear HA: Risk based in terms of Cpk: H0: Ratio HA: The sample size at or 1 for unbalanced : Sample size driven by type I and II risks and , the process risk rel. to max risk
One-sided meaningful change sample sizes Historical New A comparison of 3 batches to 3 batches requires a 3 sigma effect size A 2 sigma effect size requires a 6 batch historical database to compare to 3 new batches A 1 sigma effect size requires 20 batch historical database to compare to 10 new batches (not shown) Effect size = process capability in #sigmasvs max tolerable capability in #sigmas
Study Design Issues Designs for highly variable assays: what is a better design? Design Run 1 Run 1 Process 1 + assay P1L1 P1L1 P2L1 P1L2 Process 1 Run 2 Run 2 P2L1 P1L2 versus P2L2 P2L2 Process 2 + assay … … Process 2 Run na Run na P1Lk P1Lk P2Lk P1Lk
Sample size with control of assay variation Tested in same runs Comparisons to N2=3 new lots LSL = -1 Mean=0 USL = 1 Delta = 0.25 Run var = 2*lot var Rep var = lot var Total SD = 0.15
Summary • Many challenges in process comparison for biologics, chief being number of lots to evaluate the change • For risk based mean shift comparison, process capability needs to be at least a 4 or 5 sigma process within meaningful change windows, such as within release limits. • Careful design of method testing and use of stability information can improve sample size requirements • If this is not achievable, the test/criteria needs to be less powerful (increased producer risk), such as by “flagging” any observed difference to protect consumers risk • Flagged changes need to be assessed scientifically to determine analytical comparability
References • ICH Q5E: Comparability of Biotechnological/Biological Products Subject to Changes in their Manufacturing Process • Peterson, J. (2008), “A Bayesian Approach to the ICH Q8 Definition of Design Space,” Journal of Biopharmaceutical Statistics, 18: 959-975 • Schneider, R., Huhn, G., Cini, P. (2006). “Aligning PAT, validation, and post-validation process improvement,” Process Analytical Technology Insider Magazine, April • Chow, Shein-Chung, and Liu, Jen-pei (2009) Design and Analysis of Bioavailability and Bioequivalance Studies, CRC press • Pearnand Chen (1999), “Making Decisions in Assessing Process Capability Index Cpk”
Defining a Risk Based Meaningful Difference 2 2 3 1 3 1 CpmC Boundary CpkC Boundary 0 0 Starting process Change not meaningful 1 LRL = Lower release limit URL = Upper release limit = process mean = process variance Change meaningful 2 Risk level of meaningful differences are fine tuned through Cpk or Cpm Change borderline meaningful 3
Test Cpk? Assume process 1 is in control and has good capability (true Cpk>1) with respect to the release limits. Suppose process 2 is considered comparable to process 1 if . That is we want to test H0: Examine with scientific judgment HA: Evidence for Comparable CQAs How many lots are needed to have 80% power assuming they are measured with high precision (e.g., precision negligible) with alpha=0.05? Critical Value = Power = Pearn and Chen (1999), “Making Decisions in Assessing Process Capability Index Cpk”
Power Assume process 1 is in control and has good capability (true Cpk>1) with respect to the release limits. Suppose process 2 is considered comparable to process 1 if . That is we want to test H0: Examine further with scientific judgment HA: Evidence for Comparable CQAs Power
Comparability to Range Method Process Distribution? P1L6 P1L3 P1L4 P1L1 P1L2 P1L5 P2L2 P2L1 P2L3 H0: HA: Determine subset of all historical lots that are representative of historical lot distribution with sufficient data List of historical true lot means defines our historical distribution New process (P2) has significant evidence of comparability if the range of true lot means for the new process can be shown to be within the range of the historical true lots + meaningful difference If meaningful difference is not defined, set