Understanding Ordered Pairs and Relations: Graphing Real-Life Data
140 likes | 265 Vues
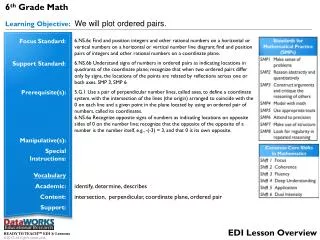
Explore how ordered pairs are utilized to graph real-life data in mathematics. This guide explains the coordinate system, including the x-axis, y-axis, and origin, as essential tools for locating points. Learn the definitions of x-coordinates and y-coordinates, and how to plot points on a graph using ordered pairs, illustrated step-by-step with an example. Additionally, understand the concept of relations, domains, and ranges through tables and graphs. Practice plotting your own data and interpreting the results for better comprehension.

Understanding Ordered Pairs and Relations: Graphing Real-Life Data
E N D
Presentation Transcript
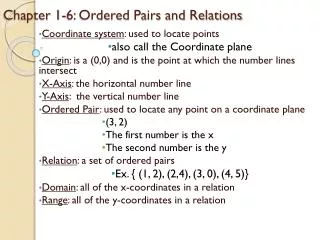
1-6 Ordered Pairs and Relations How are ordered pairs used to graph real-life data?
Vocabulary • coordinate system (coordinate plane)– used to locate points in mathematics • x-axis – the horizontal number line on the coordinate system • y-axis – the vertical number line on the coordinate system • origin – is at (0,0); the point at which the number lines intersect
ordered pair of numbers – used to locate any point on a coordinate plane • x-coordinate – first number of an ordered pair • y-coordinate – second number of an ordered pair • graph of an ordered pair- point on the coordinate system that corresponds to the ordered pair
Coordinate System coordinate plane y-axis x-axis origin
Ordered Pair x-coordinate y-coordinate
Graphing an Ordered Pair Graph (4,1) on a coordinate system. Step Three: Since the y-coordinate is 1, move 1 unit up. Draw a dot. Step Two: Since the x-coordinate is 4, move 4 units to the right. Step One: Start at the origin.
Practice Please visit http://www.cimt.plymouth.ac.uk/projects/mepres/book7/bk7i3/bk7_3i2.htm to practice plotting points. Please use your results to complete #9 in the PowerPoint Guide.
More Vocabulary • relation – a set of ordered pairs • domain – the set of x-coordinates • range – the set of y-coordinates
The following is an example of a relation, or a set of ordered pairs. The domain is (1,2,3,4) The range is (2,4,0,5)
A relationship can be shown in several ways. • Graph • Map • Ordered Pairs • Table 1 2 3 4 0 2 4 5
Express the following relation as a table. Please review the following example:
Express the following relation as a graph. Please review the following example:
Please state the domain and range of the following relation: Please review the following example: Range: {0,1,3,2} Domain: {0,2,1,5}
Please review the following example: • Some species of bamboo grow three feet in one day. • Make a table of ordered pairs in which the x-coordinate represents the number of days and the y-coordinate represents the amount of growth for 1, 2, 3, and 4 days. • Graph the ordered pairs. • Describe the graph. • The points appear to be in a line.