Download
1 / 13
130 likes | 273 Vues
Correlation --- Basic Concepts. Consists of a set of ordered pairs Indicates both the magnitude and direction of the relationship between variables Range is from -1.0 to +1.0. 85 84 83 82 81 80 79 78 77 76 75 74 73 72 71 70 69 68 67 66 65 64 63 62 61 60. * *

E N D
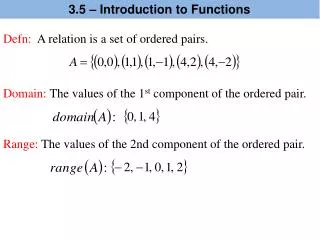
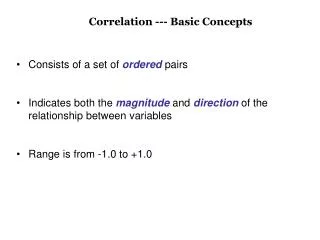
Correlation --- Basic Concepts • Consists of a set of ordered pairs • Indicates both the magnitude and direction of the relationship between variables • Range is from -1.0 to +1.0
85 84 83 82 81 80 79 78 77 76 75 74 73 72 71 70 69 68 67 66 65 64 63 62 61 60 * * * * * * * * * * * * * * * * * * * * * * * * * * * * * * * * * * * * * * * * * * * * * * * * * * * * * * * * Son’s Height 60 61 62 63 64 65 66 67 68 69 70 71 72 73 74 75 76 77 78 79 80 81 82 83 84 85 Fathers Height (in inches)
Consider these --- A correlation exists between: • The total amount of losses in a fire and the number of • firemen that were putting out the fire • Cigarette smokers and lower GPAs • The number of churches in a city and amount of alcohol • consumed • The amount of fat in diets and cancer rates
False Rejections Correct Acceptances Good Job Performance Poor False Acceptances Correct Rejections Test scores Pass Fail Cut-off score
Computation of Standard Deviation & Variance Deviation scores (scores minus the mean) Squared deviation scores TestScores X 10 20 30 40 50 -20 -10 0 10 20 x x2 400 100 0 100 400 EX2 = 1000 (Sum of the squared deviation scores) EX = 150 (EX/N) = 30 (Mean) Mean of the sum of the squared deviation scores EX2/N = 200 (the variance or s2) = standard deviation or s s2 200 = 14.14 (standard deviation)
Computational Formula for r 2 2 X Y XY X Y 1 4 4 1 16 2 3 6 4 9 3 5 15 9 25 4 7 28 16 49 5 6 30 25 36 X = 15 Y = 25 XY = 83 X = 55 Y = 135 N XY – ( X) ( Y) 5(83) – (15)(25) [N X – ( X) ][N Y - ( Y) ] [5(55) – (15) ][5(135) – (25) 415 – 375 40 40 (275 – 225)(675 – 625) (50)(50) 50 r = = = = = = .80 • 2 2 2 2 2
85 84 83 82 81 80 79 78 77 76 75 74 73 72 71 70 69 68 67 66 65 64 63 62 61 60 * * * * * Positive Correlation * * * * * * * * * * Job Performance * * * * * * * * * * * * * * * * * * * * * * * * * * * * * * * * * * * * * * * * * 60 61 62 63 64 65 66 67 68 69 70 71 72 73 74 75 76 77 78 79 80 81 82 83 84 85 Test Scores
85 84 83 82 81 80 79 78 77 76 75 74 73 72 71 70 69 68 67 66 65 64 63 62 61 60 * * * * * * * * Negative Correlation * * * * * * * * * * * Job Performance * * * * * * * * * * * * * * * * * * * * * * * * * * * * * * * * * * * * * 60 61 62 63 64 65 66 67 68 69 70 71 72 73 74 75 76 77 78 79 80 81 82 83 84 85 Absenteeism (in hours)
85 84 83 82 81 80 79 78 77 76 75 74 73 72 71 70 69 68 67 66 65 64 63 62 61 60 False Rejections Correct Acceptances * * * * * * * * * * Good * * * * * * * * * * * Job Performance * * * * * * * * * * * * * * * * * * * * * * * * * * * * * * * * * * * Poor False Acceptances Correct Rejections 60 61 62 63 64 65 66 67 68 69 70 71 72 73 74 75 76 77 78 79 80 81 82 83 84 85 Fail Pass Test Scores Significant Correlation
85 84 83 82 81 80 79 78 77 76 75 74 73 72 71 70 69 68 67 66 65 64 63 62 61 60 False Rejections Correct Acceptances * * * * * * * * * * * * * * * * * * * * * Good * * * * * * * * * * * * * * Job Performance * * * * * * * * * * * * * * * * * * * * * * * * * * * * * * * * * * * * * * * * * * * * * * * * Poor * * * * * * * * False Acceptances Correct Rejections 60 61 62 63 64 65 66 67 68 69 70 71 72 73 74 75 76 77 78 79 80 81 82 83 84 85 Fail Pass No Correlation Test Scores
85 84 83 82 81 80 79 78 77 76 75 74 73 72 71 70 69 68 67 66 65 64 63 62 61 60 False Rejections Correct Acceptances * * * * * * * * * * Good * * * * * * * * * * * Job Performance * * * * * * * * * Effect of raising cutoff score? * * * * * * * * * * * * * * * * * * * * * * * * * * Poor False Acceptances Correct Rejections 60 61 62 63 64 65 66 67 68 69 70 71 72 73 74 75 76 77 78 79 80 81 82 83 84 85 Fail Pass Test Scores Significant Correlation
85 84 83 82 81 80 79 78 77 76 75 74 73 72 71 70 69 68 67 66 65 64 63 62 61 60 False Rejections Correct Acceptances * * * * * * * * * * Good * * * * * * * * * * * Job Performance * * * * * * * * * Effect of lowering cutoff score? * * * * * * * * * * * * * * * * * * * * * * * * * * Poor False Acceptances Correct Rejections 60 61 62 63 64 65 66 67 68 69 70 71 72 73 74 75 76 77 78 79 80 81 82 83 84 85 Fail Pass Test Scores Significant Correlation