Download
1 / 48
480 likes | 611 Vues
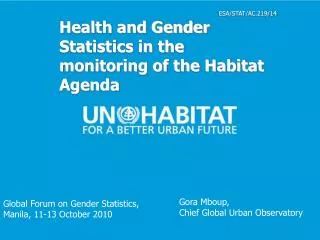
ESA/STAT/AC.219/14 Health and Gender Statistics in the monitoring of the Habitat Agenda. Gora Mboup, Chief Global Urban Observatory. Global Forum on Gender Statistics, Manila, 11-13 October 2010. 1. Urban Development Challenges. Urban Development Challenges.

E N D
ESA/STAT/AC.219/14 Health and Gender Statistics in the monitoring of the Habitat Agenda Gora Mboup, Chief Global Urban Observatory Global Forum on Gender Statistics, Manila, 11-13 October 2010 1
Urban Development Challenges 2. THE URBANIZATION OF POVERTY 40 to 80 per cent of urban dwellers in the world are living in poverty
Urban Development Challenges The urbanization of poverty would be characterized by: • Overcrowding • Homelessness • Environmental health problems • Increased vulnerability • Segregation • Violence and criminality
Monitoring the Habitat Agenda “All partners of the Habitat Agenda, including local authorities, the private sector and communities, should regularly monitor and evaluate their own performances in the implementation of the Habitat Agenda through comparable human settlements and shelter indicators and documented best practices“ [240]
Habitat Agenda: chapters, goals and indicators Chapters • 1 Shelter • 2 Social development • 3 Environmental management • 4 Economic development • 5 Governance
Chapter 2-Goal 6: Provide equal opportunities for a safe and healthy life
Environment and health inequalities in cities Environmental inequalities lead to worse health and greater risks of premature death. Child mortality rates remain highly associated with various acute respiratory infections, diarrhoeal diseases, malaria and diseases related to air pollution, which in turn are related to various environmental health hazards such as lack of sanitation and hygiene, lack of access to safe water, poor housing conditions, poor management of solid wastes, and many other external health hazards. High-density living in slums and squatter settlements and poor quality housing in general intensify the risk of diseases.
Where we live matters for healthHousing and access to basic services
Poor management of solid waste exposes urban population to multiple environmental diseases Improperly managed solid waste can clog storm drains, causes flooding, creates garbage heaps in surrounding areas, and provides breeding and feeding grounds for mosquitoes, flies, and rodents. these can cause diarrhoeas, parasitic infections, and injuries. Pools of standing water and flooding can lead to increased incidence of malaria and other mosquito-borne diseases, especially during the rainy season, placing workers and local residents at risk. Public facilities often fall into disrepair for lack of maintenance, setting the stage for accidents and poor waste management. Living in a poor environment can also reduce the efficiency of access to other shelter services.
Indoor air pollution increase respiratory Diseases in slum areas It is estimated that indoor air pollution is responsible for between 2.7 and 2.8 million deaths annually. This makes it the second leading environmental health threat in the world, especially in women who cook and their children. Women usually have the added responsibility of caring for children who are then also exposed to high levels of indoor air pollution on a daily basis. Strong associations between bio-fuel exposure and increased incidences of chronic bronchitis in women and acute respiratory infections in children have been documented. A primary source of indoor air pollution is the burning of domestic fuels used for cooking (e.g., biomass, charcoal, wood, coal).
Findings from Demographic and Health Surveys Multiple Indicators Cluster Surveys Urban Inequities Surveys
Diarrhea in the last two weeks by sexin urban area Computed from DHS
Diarrhea in the last two weeks by sexin non-slum area Computed from DHS
Diarrhea in the last two weeks by sexin slum area Computed from DHS
Treatment of diarrhea by sexin urban area Computed from DHS
Treatment of diarrhea by sexin non-slum area Computed from DHS
Treatment of diarrhea by sexin slum area Computed from DHS
Acute Respiratory Infections in the last two weeks by sex, urban area Computed from DHS
Acute Respiratory Infections in the last two weeks by sex, non-slum area Computed from DHS
Acute Respiratory Infections in the last two weeks by sex, slum area Computed from DHS
Treatment of ARI by sexin urban area Computed from DHS
Treatment of ARI by sexin non-slum area Computed from DHS
Treatment of ARI by sexin slum area Computed from DHS
Children 12-23 months that had received all vaccines, urban area Computed from DHS
Children 12-23 months that had received all vaccines, non-slum area Computed from DHS
Children 12-23 months that had received all vaccines, slum area Computed from DHS
Children under-five malnourished (underweighted), urban area Computed from DHS
Children under-five malnourished (underweighted), non-slum area Computed from DHS
Children under-five malnourished (underweighted), slum area Computed from DHS
Unsafe social environments (home, school, park) in urban slum Expose girls and women to high risk morbidity Social environments in many slum areas are not child-friendly and in some cases, they are even hazardous for girls. For instance, in slum areas served by several schools, the number may not be sufficient to accommodate all children, leading to an overcrowded educational environment. In many slum areas, public/private toilets are overcrowded, putting girls and women at risk of sexual harassment which is more possible in overcrowded neighborhood. Girls and women often submit to unwanted sexual advances from their counterpart boys a and men that expose them to unwanted pregnancies, unsafe abortions, HIV/AIDS and other sexually transmitted diseases
Diagnosis of Insecurity: tools • Victimisation Survey: scientific tool for city-wide inquiry in levels of victimisation of residents • Security Diagnosis: snapshot assessment of main insecurity and crime problems • Neighbourhood Safety Audits: a walk involving residents and government officials identifying physical aspects of a neighbourhood that contribute to insecurity • Youth Offender Profiles: qualitative and quantitative assessments of youth delinquency and its causes • Violence against Women Survey: qualitative assessment of characteristics of women abuse, its victims and perpetrators
Victimization survey: tools Household survey is among the tools of victimization; it is usually carried out among residents on opinions and experiences on a number of different issues concerning safety and crime. The focus of the main survey is on 4 components namely individual crimes, household crimes, property crimes, and commercial crimes. The survey is designed to provide for an in-depth analysis of certain categories of crime, determine their extent in the city, identify the populations most at risk, understand the nature of crimes and measure public perception of those crimes.
Safer Cities Urban Insecurity – The Facts • Two out of three inhabitants of big cities are victim of crime every 5 years • Crime in the cities of the South and youth crime everywhere • Insecurity affects all, and in particular vulnerable groups including girls and women • Vicious circle between crime/fear and the degradation of public space
Characteristics of Urban Crime • More than 50% of urban crime is against property (theft, burglary, mugging, car hijacking) • Violent crime accounts for 25% to 30% of offences in developing cities • 25% of violent crime involve domestic violence against women
Causes of Crime and Contributing Factors The causes of crime are manifold but may be placed in 3 major categories: • Social • Institutional • Situational (Physical urban environment)
Causes of Crime and Contributing Factors • Social Causes: • social exclusion and marginalisation • lack of social control • lack of socialisation in the family and schooling • lack/crisis in local traditions and values • lack of integration into society
Causes of Crime and Contributing Factors • Situational (Physical urban environment) Causes: • failure to master the urbanisation process • lack of urban services • absence of the conception of security in urban polices and planning • degradation of urban neighbourhoods • crowding and illegitimacy of certain quarters that causes non-legal zones and trafficking of weapons
Consequences of Crime General feeling of insecurity which results in: • abandonment of neighbourhoods and avoidance of certain quarters • development of an “architecture of fear” • stigmatization of certain quarters or populations • creation of climate that threatens the foundation of democratic institutions in urban areas
Indicator 2.1: Under-five mortality Habitat Agenda Goal 6: Provide equal opportunities for a safe and healthy life • Rationale:Under-five mortality is a powerful indicator of quality of life in cities. High child mortality is directly correlated to low environmental indicators such as the level of wastewater treatment and sewerage and sanitation facilities. • Definition:Probability, expressed as a rate per 1,000 live births, of a child born in a specified year dying before reaching the age of five. • Methodology:Data collection and sources:Age-specific mortality rates are calculated from data on births and deaths in vital statistics registries, censuses and household surveys in developing countries. Estimates based on household surveys data are obtained directly (using birth history, as in Demographic and Health Surveys) or indirectly (Brass method, as in Multiple Indicator Cluster Surveys, UNICEF). The data are then summed for children under five, and the results are expressed as a rate per 1,000 live births.Computation:At the city level, the best source of data is a complete vital statistics registration system—one covering at least 90 percent of vital events in the population. Such systems are uncommon in developing countries, so estimates are also obtained from sample surveys or derived by applying direct and indirect estimation techniques to registration, census or survey data. A wide variety of household surveys, including Multiple Indicator Cluster Surveys and Demographic and Health Surveys, are used in developing countries. • Gender:Under-five mortality rates are higher for boys than for girls in countries without significant parental gender preferences. Under-five mortality better captures the effect of gender discrimination than infant mortality, as nutrition and medical interventions are more important in this age group, while biological differences have a higher impact during the first year of life .There may be gender-based biases in the reporting of child deaths.
Indicator 2.2: HomicidesHabitat Agenda Goal 6: Provide equal opportunities for a safe and healthy life • Rationale:Crime rates provide useful information on the level of security in a city. However, the number of reported murders only represents the apparent crime. Crime rates should be taken with caution and reporting should mention the possible gaps between the official figures and the reality. • Definition:Number of reported homicides (male and female victims) annually per 10,000 population. • Methodology:Homicide includes intentional and non-intentional homicide. Intentional homicide refers to death deliberately inflicted on a person by another person, including infanticide. Non-intentional homicide refers to death non-deliberately inflicted on a person by another person. This includes manslaughter but excludes traffic accidents that result in the death of a person. This definition is the one used by the United Nations Statistics Division. The data may be obtained from the police or other law enforcement agencies. Information may also be checked with security experts and NGOs dealing with human rights. • Gender:Women and men are differently affected by crimes. Therefore, indicators should be disaggregated by sex of the victims. Also, homicides have different causes, one of them being domestic violence. This particular issue may be examined by looking at the number of homicides by cause, if this is reported by the police and other law enforcement agency.
Indicator 2.4: Urban violence Habitat Agenda Goal 6: Provide equal opportunities for a safe and healthy life • Rationale: Since crime rates provide only a partial picture of the level of urban violence, this Indicator provides complementary information at the city level. Whether or not the city has areas considered as dangerous or inaccessible to the police and children experiencing violence at school are good indication of the level of urban violence. Major policies and programme against crimes and violence include official policy against domestic violence, crime and weapon control prevention policy and victim of violence assistance programmes.
Victimization survey • Crime Survey • Transport and accident