RATING CURVE VALIDATION (1)
RATING CURVE VALIDATION (1). WHEN VALIDATION: ON FITTED RELATION WHEN NEW GAUGINGS BECOME AVAILABLE TO TEST CHANGE IN RATING AT LEAST 6 GAUGINGS AT STABLE SITES AT UNSTABLE SITES MORE GAUGINGS ARE NEEDED COVERING FULL FLOW RANGE TESTS: GRAPHICAL NUMERICAL. OHS - 1.

RATING CURVE VALIDATION (1)
E N D
Presentation Transcript
RATING CURVE VALIDATION (1) • WHEN VALIDATION: • ON FITTED RELATION • WHEN NEW GAUGINGS BECOME AVAILABLE TO TEST CHANGE IN RATING • AT LEAST 6 GAUGINGS AT STABLE SITES • AT UNSTABLE SITES MORE GAUGINGS ARE NEEDED COVERING FULL FLOW RANGE • TESTS: • GRAPHICAL • NUMERICAL OHS - 1
VALIDATION OF RATING CURVES (2) • GRAPHICAL • STAGE-DISCHARGE PLOT WITH NEW GAUGINGS • PERIOD-FLOW DEVIATION SCATTERGRAM • STAGE-FLOW DEVIATION SCATTERGRAM • CUMULATIVE DEVIATION PLOT OF GAUGINGS • Q-h PLOTS FOR DISTINCT SEASONS • NUMERICAL • t-TEST ON STANDARDISED MEAN DEVIATION • TEST ON ABSENCE OF BIAS IN SIGNS • TEST OF BIAS IN VALUES • GOODNESS OF FIT TEST OHS - 2
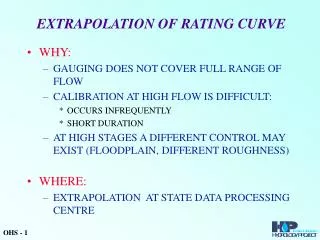
RATING CURVE FITTING OHS - 3
RESULTS OF CURVE FITTING Analysis of stage-discharge data Station name : PARGAON Data from 1997 6 30 to 1997 8 2 Single channel Given boundaries for computation of rating curve(s) interval lower bound upper bound nr. of data 1 508.000 510.200 49 2 509.900 515.000 12 Power type of equation q=c*(h+a)**b is used Boundaries / coefficients lower bound upper bound a b c 508.00 509.98 -507.730 1.489 .1043E+03 509.98 515.00 -508.490 1.475 .1936E+03 Number W level Q meas Q comp DIFf Rel.dIFf Semr M M3/S M3/S M3/S 0/0 0/0 54 508.050 22.830 19.116 3.714 19.43 4.44 56 511.240 820.010 861.213 -41.203 -4.78 2.58 57 510.740 711.230 640.582 70.648 11.03 2.96 62 512.620 1566.740 1568.961 -2.221 -.14 3.12 63 514.510 2757.370 2735.225 22.145 .81 4.60 64 514.360 2609.830 2635.279 -25.448 -.97 4.49 65 513.530 2098.120 2104.625 -6.505 -.31 3.84 66 512.010 1235.470 1239.485 -4.015 -.32 2.71 67 511.730 1103.470 1096.850 6.620 .60 2.59 Overall standard error = 6.061 Statistics per interval Interval Lower bound Upper bound Nr.of data Standard error 1 508.000 509.981 48 6.55 2 509.981 515.000 12 4.01 OHS - 4
RESULTS OF VALIDATION OHS - 5
RESULTS OF VALIDATION OHS - 6
STAGE-FLOW DEVIATION DIAGRAM OHS - 8
CUMULATIVE DEVIATION PLOT OHS - 9
TEST: DEVIATION FROM CURVE IS d1 MEAN DEVIATION FROM EXISTING CURVE STANDARDISED BY STANDARD ERROR S IS UNDER TEST IF COMPUTED ‘t’ IS LARGER THAN CRITICAL ‘t’-VALUE FOR N+N1-2degrees of freedom AT 95% CONFIDENCE LEVEL THEN FURTHER ACTION REQUIRED USE OF STUDENT’s t-TEST OHS - 10
EXAMPLE OF ‘t’-TEST Validation stage-discharge dataStation name : PARGAON Data from 1997 8 2 to 1997 8 22 Procedure : Standard Equation type: Power Interval Boundaries Parameters: 1 508.000 509.981 -507.730 1.489 104.324 2 509.981 515.000 -508.490 1.475 193.614 Data used to estimate parameters: Interval St. error of est. Number of data 1 6.546 48 2 4.013 12 Number W level Q meas Q comp DIFf Rel.dIFf Semr M M3/S M3/S M3/S 0/0 0/0 81 509.990 368.450 352.261 16.189 4.60 15.48 82 509.420 285.790 227.843 57.947 25.43 15.51 83 509.220 247.940 188.880 59.060 31.27 11.81 84 509.060 217.610 159.488 58.122 36.44 10.23 85 508.960 189.660 141.964 47.696 33.60 10.57 86 508.850 177.270 123.482 53.788 43.56 12.38 87 508.810 177.270 116.972 60.298 51.55 13.39 88 508.740 130.970 105.863 25.107 23.72 15.53 89 508.730 130.970 104.309 26.661 25.56 15.88 90 508.920 163.570 135.149 28.421 21.03 11.05 Overall standard error = 14.729 Statistics per interval Interval Lower bound Upper bound Nr.of data Standard error 1 508.000 509.981 27 25.78 2 509.981 515.000 15 13.18 Results of student T-test on absence of bias Interval Degrees of freedom 95% T-value Actual T-value Result 1 73 1.993 7.673 Reject 2 25 2.060 2.920 Reject OHS - 11
TEST: N = NUMBER OF MEASUREMENTS N1 = NUMBER OF MEASUREMENTS WITH QI-QC>0 p IS PROBABILITY OF SIGNS BEING POSITIVE IF ‘t’ EXCEEDS CRITICAL t 95% VALUE THEN ACTION IS TO BE TAKEN ABSENCE FROM BIAS TEST (SIGNS) OHS - 12
TEST: WHETHER RATING CURVE YIELDS SIGNIFICANT UNDER- OR OVER ESTIMATES AS COMPARED TO THE ACTUAL OBSERVATIONS PERCENTAGE DIFFERENCES TAKEN BECAUSE OF INDEPENDENCE OF DISCHARGE VOLUME IF COMPUTED ‘t’-VALUE EXCEEDS t95% THEN BIAS IS LIKELY ABSENCE FROM BIAS TEST (VALUES) P=100(Qi-Qc)/Qc t=Pav/Se OHS - 13
TEST: ON RANDOMNESS OF DEVIATIONS FROM THE RATING CURVE APPLIED TO LONG RUNS OF POSITIVE AND NEGATIVE DEVIATIONS N’ = no’s of changes in sign p =prob of change in sign q =prob of no change p=q=1/2 IF ‘t’ EXCEEDS t95% VALUE THEN RENEWED ACTION REQUIRED GOODNESS OF FIT TEST OHS - 14