Understanding Variance and Standard Deviation in Random Variables
This lesson explores variance and standard deviation, key concepts in statistics that measure data dispersion. The expected value of a random variable provides the average of the distribution, while standard deviation indicates how spread out the data points are from this average. Variance, the square of standard deviation, quantifies this dispersion further. Through practical examples involving discrete and continuous random variables, learners will understand how to calculate and interpret these statistical measures.

Understanding Variance and Standard Deviation in Random Variables
E N D
Presentation Transcript
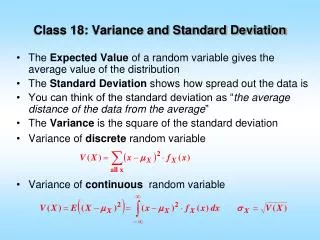
Class 18: Variance and Standard Deviation • The Expected Value of a random variable gives the average value of the distribution • The Standard Deviation shows how spread out the data is • You can think of the standard deviation as “the average distance of the data from the average” • The Variance is the square of the standard deviation • Variance of discrete random variable • Variance of continuous random variable
Variance, Dispersion Variance. Dispersion Text Example1. Suppose that we put 20 slips of paper, bearing the following numbers, into a box. 2, 3, 3, 3, 4, 4, 4, 4, 4, 4, 4, 4, 4, 4, 4, 4, 5, 5, 5, 6 Let X be number on a slip that is drawn, at random, from the box. We put 20 slips of paper, bearing the following numbers, into a second box and let Y be the number on a slip that is drawn, at random, from that box. 1, 1, 2, 2, 2, 3, 3, 3, 4, 4, 4, 4, 5, 5, 5, 6, 6, 6, 7, 7