Download
1 / 35
370 likes | 524 Vues
Learn the physical principles of Magnetic Resonance Imaging, including spatial encoding, pulse sequences, contrast mechanisms, and spectroscopy. Delve into 2D and 3D imaging techniques, chemical shift, and blood flow imaging. Explore MRI physics for medical applications.

E N D
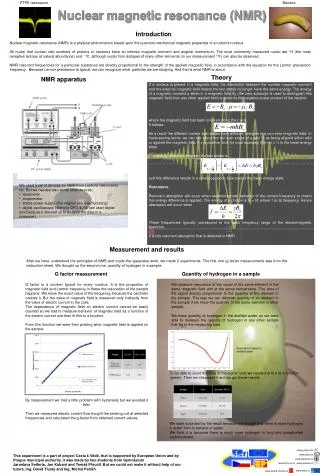
Magnetic Resonance Imaging:Physical Principles Richard Watts, D.Phil. Weill Medical College of Cornell University, New York, USA
Nuclear Magnetic Resonance Nuclear spins Spin precession and the Larmor equation Static B0 RF excitation RF detection Spatial Encoding Slice selective excitation Frequency encoding Phase encoding Image reconstruction Fourier Transforms Continuous Fourier Transform Discrete Fourier Transform Fourier properties k-space representation in MRI Physics of MRI, Lecture 1
2D Pulse Sequences Spin echo Gradient echo Echo-Planar Imaging Medical Applications Contrast in MRI Bloch equation Tissue properties T1 weighted imaging T2 weighted imaging Spin density imaging Examples Physics of MRI, Lecture 2
3D Imaging Magnetization Preparation Chemical Shift and FatSat Water/Fat Separation Inversion Recovery and T1 Measurement Double Inversion Recovery Imaging blood flow Time-of-Flight Phase Contrast Fast Imaging Spoiling Spin Saturation Ernst angle, signal and contrast levels Physics of MRI, Lecture 3
Spatial encoding It’s all done with gradient fields Spatially varying Larmor precession frequency Slice select Frequency encode Phase encode Tissue contrast Different magnetic properties of tissues Different relaxation times T1 = Longitidunal relaxation constant T2 = Transverse relaxation constant Scan Parameters TE = Echo time TR = Repetition time Summary – So Far
Spatial Encoding – Slice Selection RF Gz Resonant Frequency
2D Spatial Encoding – Frequency and Phase Encoding Gx Phase Shift Frequency X-Position Phase Y-Position Phase encoding
3D Imaging • Instead of exciting a thin slice, excite a thick slab and phase encode along both ky and kz • Greater signal because more spins contribute to each acquisition • Easier to excite a uniform, thick slab than very thin slices • No gaps between slices • Motion during acquisition can be a problem
2D Sequence (Gradient Echo) ky acq Gx Gy kx Gz b1 TE Scan time = NyTR TR
3D Sequence (Gradient Echo) acq kz Gx Gy Gz ky kx b1 Scan time = NyNzTR
3D Imaging - example • Contrast-enhanced MRA of the carotid arteries. Acquisition time ~25s. • 160x128x32 acquisition (kxkykz). • 3D volume may be reformatted in post-processing. Volume-of-interest rendering allows a feature to be isolated. • More on contrast-enhanced MRA later
Chemical Shift - Spectroscopy • Precession frequency depends on the chemical environment e.g. Hydrogen in water and hydrogen in fat have a f = fwater – ffat = 220 Hz • Single voxel spectroscopy excites a small (~cm3) volume and measures signal as f(t). Different frequencies (chemicals) can be separated using Fourier transform • Concentrations of chemicals other than water and fat tend to be very low, so signal strength is a problem • Creatine, lactate and NAA are useful indicators of tumor types
Spectroscopy - Example Intensity (Concentration) Frequency
Chemical Shift - FatSat • Use a small bandwidth (long, ~20ms) 90º pulse to excite only protons within fat • Destroy the transverse magnetization by dephasing (spoiling) • Not spatially selective – no gradients • Useful for reducing the fat signal in abdominal and breast imaging • Cost – extra acquisition time
Chemically Selective Saturation Resolution Phantom (water) Bottle of Oil (fat) No saturation Fat saturation No saturation
Water/Fat Separation Proton spin in fat precesses at a frequency lower than in water (-220Hz at 1.5T). fwater = ffat + 2p.Df.TE @ TE1 = 1/Df = 4.55 msec, I1 = Iwater + Ifat @ TE2 = 3/(2Df) = 6.82 msec, I2 = Iwater Ifat Then, Iwater = (I1+I2)/2, Ifat = (I1 I2)/2
Inversion Recovery (IR) • After 180 inversion pulse the longitudinal relaxation Mz grows back towards its equilibrium value, M0 • Mz = 0 when e-t/T1 = ½ • T= T1.ln2 • Select the inversion time, TI to null out the required signal
Inversion Recovery (IR) 1800 RF Rest of Sequence TI (inversion time) T1=260 Mz T1=1000
Inversion Recovery - Example No Inversion Recovery Inversion Recovery, TI = 150ms Oil (fat)
Measurement of T1 • Image using different inversion times (TI) until the signal is minimized • Signal |Mz(TI) |
Measurement of T2 • Measure signal as a function of echo time, TE • Spin echo sequence gives T2 (irreversible) • Gradient echo sequence gives T2* (reversible and irreversible)
Double Inversion Recovery 1800 1800 • With two inversion pulses at appropriate times, two tissue types can be nulled out • e.g. CSF and fat in the brain Mz
Blood Flow – Time of Flight Effect a RF • Fast imaging TR<T1, T2 • Spins do not fully recover after each repetition • Magnetization producing MR signal decreases with the number of pulses until equilibrium reached • Spins flowing into the slice have not “seen” previous excitations, so have greater signal Mz fresh inflow spin inplane stationary spin More on spin saturation later
Time of Flight - Example Renal arteries Aorta Inflow from vein Inversion recovery (TI 300 ms) FatSat Inversion recovery (TI 300 ms) FatSat IR Volume extends more inferior so that vein signal is also saturated
Blood Flow – Phase Contrast • For constant flow velocity, • With an x-Gradient Gx, the field strength is • The phase shift is linear with velocity • With a given gradient field, stationary spins precess at a constant rate • Moving spins experience a change in precession frequency, depending on their velocity v, and the gradient strength, G. • This causes a velocity-dependent phase shift, f
Blood Flow – Phase Contrast Acquisition 1: Gx Acquisition 2: Gx • Add bipolar gradient in the flow direction after RF excitation • Stationary spins are not dephased • Repeat acquisition with reversed gradients • Complex subtraction of images gives flow image Gz RF Gx1: fflow = gvM1, fstationary = 0 Gx2: fflow = -gvM1, fstationary = 0 |I1-I2| ~ rflowsin gvM1
Phase Contrast - Example Kidney Transplant
Fast Imaging • Longitudinal magnetization: Spins get “beaten down” so that after each pulse there is less magnetization available. • Equilibrium between pulses and relaxation • Optimum angle to maximize steady-state signal – Ernst angle • Fast imaging = TR<T1,T2 • Spins do not have time to relax between one RF pulse and the next • Transverse magnetization: Spin memory produces artifacts in images. Many RF pulses contribute to each acquisition
Spoiling Readout • Destroy transverse magnetization so it doesn’t contribute to later echoes • Dephase the spins with large spoiling gradients after each acquisition • Assume perfect spoiling Phase encoding Slice encoding Spoiler
Spin Saturation • At equilibrium full magnetization is available • Each pulse and spoiling reduces the magnetization • Some signal regrowth due to T1 decay 1. Equilibrium M=M0 3. Spoiling M=M0cos 5. RF Excitation Flip Angle 2. RF Excitation Flip Angle 4. T1 Regrowth 6. Spoiling
Ernst Angle Maximize the equilibrium transverse magnetization available signal Calculate the optimum flip angle for a required TR Immediately after nth TR After RF Flip of and spoiling After T1 recovery
Ernst Angle In equilibrium, Mz(n+1)=Mz(n)=Mz Equilibrium Transverse Magnetization, M=Mzsin Show that Maximum Transverse Magnetization (signal) when E = Ernst Angle